Iroquois vs Comanche Median Female Earnings
COMPARE
Iroquois
Comanche
Median Female Earnings
Median Female Earnings Comparison
Iroquois
Comanche
$36,408
MEDIAN FEMALE EARNINGS
0.1/ 100
METRIC RATING
280th/ 347
METRIC RANK
$35,661
MEDIAN FEMALE EARNINGS
0.0/ 100
METRIC RATING
295th/ 347
METRIC RANK
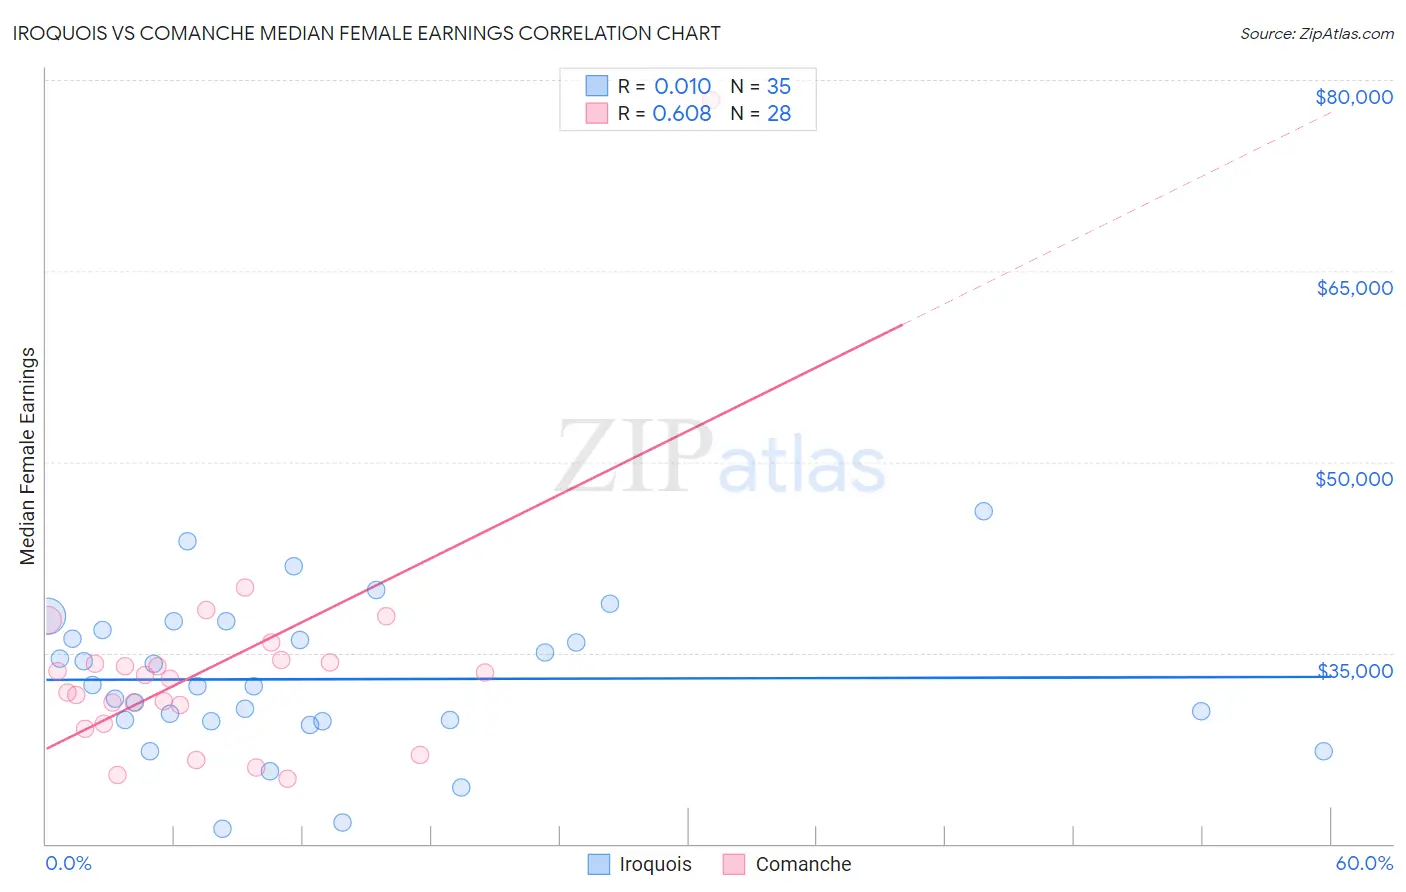
Iroquois vs Comanche Median Female Earnings Correlation Chart
The statistical analysis conducted on geographies consisting of 207,213,781 people shows no correlation between the proportion of Iroquois and median female earnings in the United States with a correlation coefficient (R) of 0.010 and weighted average of $36,408. Similarly, the statistical analysis conducted on geographies consisting of 109,756,357 people shows a significant positive correlation between the proportion of Comanche and median female earnings in the United States with a correlation coefficient (R) of 0.608 and weighted average of $35,661, a difference of 2.1%.
Median Female Earnings Correlation Summary
| Measurement | Iroquois | Comanche |
| Minimum | $21,202 | $25,100 |
| Maximum | $46,154 | $78,452 |
| Range | $24,952 | $53,352 |
| Mean | $32,927 | $33,877 |
| Median | $32,405 | $33,076 |
| Interquartile 25% (IQ1) | $29,643 | $30,131 |
| Interquartile 75% (IQ3) | $36,768 | $34,372 |
| Interquartile Range (IQR) | $7,125 | $4,241 |
| Standard Deviation (Sample) | $5,712 | $9,585 |
| Standard Deviation (Population) | $5,630 | $9,413 |
Demographics Similar to Iroquois and Comanche by Median Female Earnings
In terms of median female earnings, the demographic groups most similar to Iroquois are Immigrants from Caribbean ($36,414, a difference of 0.020%), U.S. Virgin Islander ($36,424, a difference of 0.050%), Spanish American ($36,391, a difference of 0.050%), Haitian ($36,374, a difference of 0.090%), and Marshallese ($36,459, a difference of 0.14%). Similarly, the demographic groups most similar to Comanche are Cheyenne ($35,673, a difference of 0.030%), Guatemalan ($35,695, a difference of 0.090%), Mexican American Indian ($35,629, a difference of 0.090%), American ($35,777, a difference of 0.32%), and Hmong ($35,498, a difference of 0.46%).
| Demographics | Rating | Rank | Median Female Earnings |
| Marshallese | 0.1 /100 | #277 | Tragic $36,459 |
| U.S. Virgin Islanders | 0.1 /100 | #278 | Tragic $36,424 |
| Immigrants | Caribbean | 0.1 /100 | #279 | Tragic $36,414 |
| Iroquois | 0.1 /100 | #280 | Tragic $36,408 |
| Spanish Americans | 0.1 /100 | #281 | Tragic $36,391 |
| Haitians | 0.1 /100 | #282 | Tragic $36,374 |
| Immigrants | Haiti | 0.1 /100 | #283 | Tragic $36,203 |
| Indonesians | 0.1 /100 | #284 | Tragic $36,140 |
| Paiute | 0.1 /100 | #285 | Tragic $36,056 |
| Osage | 0.0 /100 | #286 | Tragic $36,034 |
| Immigrants | Nicaragua | 0.0 /100 | #287 | Tragic $36,023 |
| Immigrants | Zaire | 0.0 /100 | #288 | Tragic $36,017 |
| Bangladeshis | 0.0 /100 | #289 | Tragic $35,960 |
| Central American Indians | 0.0 /100 | #290 | Tragic $35,930 |
| Blackfeet | 0.0 /100 | #291 | Tragic $35,864 |
| Americans | 0.0 /100 | #292 | Tragic $35,777 |
| Guatemalans | 0.0 /100 | #293 | Tragic $35,695 |
| Cheyenne | 0.0 /100 | #294 | Tragic $35,673 |
| Comanche | 0.0 /100 | #295 | Tragic $35,661 |
| Mexican American Indians | 0.0 /100 | #296 | Tragic $35,629 |
| Hmong | 0.0 /100 | #297 | Tragic $35,498 |