Colombian vs Chinese Wage/Income Gap
COMPARE
Colombian
Chinese
Wage/Income Gap
Wage/Income Gap Comparison
Colombians
Chinese
24.7%
WAGE/INCOME GAP
92.4/ 100
METRIC RATING
133rd/ 347
METRIC RANK
25.9%
WAGE/INCOME GAP
42.0/ 100
METRIC RATING
178th/ 347
METRIC RANK
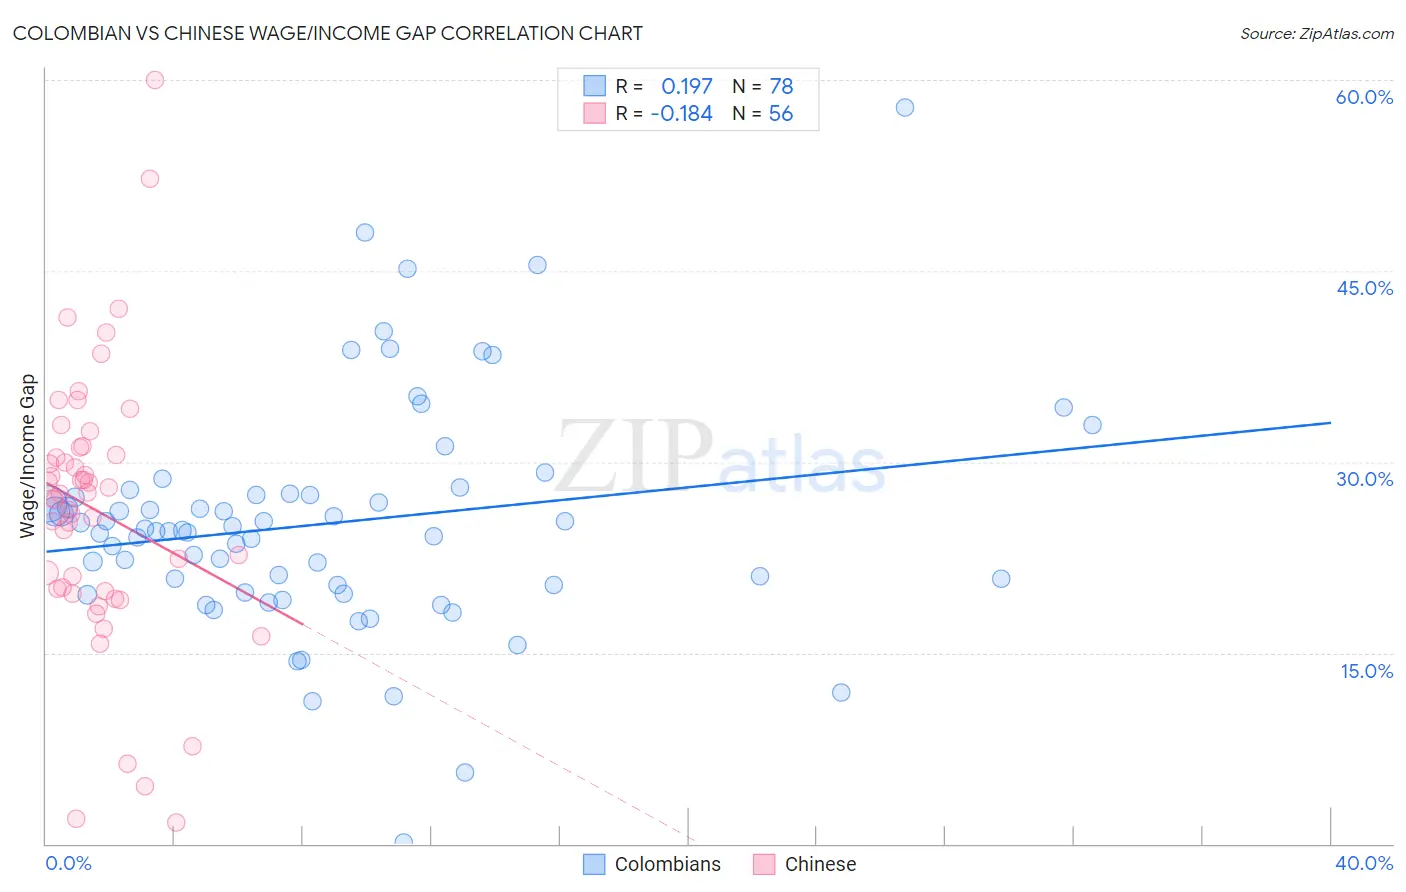
Colombian vs Chinese Wage/Income Gap Correlation Chart
The statistical analysis conducted on geographies consisting of 419,429,082 people shows a poor positive correlation between the proportion of Colombians and wage/income gap percentage in the United States with a correlation coefficient (R) of 0.197 and weighted average of 24.7%. Similarly, the statistical analysis conducted on geographies consisting of 64,807,074 people shows a poor negative correlation between the proportion of Chinese and wage/income gap percentage in the United States with a correlation coefficient (R) of -0.184 and weighted average of 25.9%, a difference of 4.8%.
Wage/Income Gap Correlation Summary
| Measurement | Colombian | Chinese |
| Minimum | 0.074% | 1.7% |
| Maximum | 57.8% | 60.0% |
| Range | 57.8% | 58.3% |
| Mean | 25.2% | 26.2% |
| Median | 24.6% | 27.3% |
| Interquartile 25% (IQ1) | 20.3% | 19.9% |
| Interquartile 75% (IQ3) | 27.4% | 30.9% |
| Interquartile Range (IQR) | 7.1% | 10.9% |
| Standard Deviation (Sample) | 9.1% | 10.8% |
| Standard Deviation (Population) | 9.0% | 10.7% |
Similar Demographics by Wage/Income Gap
Demographics Similar to Colombians by Wage/Income Gap
In terms of wage/income gap, the demographic groups most similar to Colombians are Immigrants from Costa Rica (24.7%, a difference of 0.0%), Mexican American Indian (24.7%, a difference of 0.030%), South American Indian (24.7%, a difference of 0.090%), Immigrants from Philippines (24.7%, a difference of 0.15%), and Alsatian (24.7%, a difference of 0.22%).
| Demographics | Rating | Rank | Wage/Income Gap |
| Immigrants | Uruguay | 93.8 /100 | #126 | Exceptional 24.6% |
| German Russians | 93.7 /100 | #127 | Exceptional 24.6% |
| Immigrants | Central America | 93.5 /100 | #128 | Exceptional 24.6% |
| Yup'ik | 93.3 /100 | #129 | Exceptional 24.7% |
| Alsatians | 93.2 /100 | #130 | Exceptional 24.7% |
| Immigrants | Philippines | 93.0 /100 | #131 | Exceptional 24.7% |
| Immigrants | Costa Rica | 92.4 /100 | #132 | Exceptional 24.7% |
| Colombians | 92.4 /100 | #133 | Exceptional 24.7% |
| Mexican American Indians | 92.2 /100 | #134 | Exceptional 24.7% |
| South American Indians | 92.0 /100 | #135 | Exceptional 24.7% |
| Armenians | 91.3 /100 | #136 | Exceptional 24.8% |
| Immigrants | South Eastern Asia | 90.9 /100 | #137 | Exceptional 24.8% |
| Immigrants | Bosnia and Herzegovina | 90.1 /100 | #138 | Exceptional 24.8% |
| Hispanics or Latinos | 89.5 /100 | #139 | Excellent 24.9% |
| Immigrants | Nepal | 89.3 /100 | #140 | Excellent 24.9% |
Demographics Similar to Chinese by Wage/Income Gap
In terms of wage/income gap, the demographic groups most similar to Chinese are Cambodian (25.8%, a difference of 0.21%), Samoan (26.0%, a difference of 0.23%), Guamanian/Chamorro (26.0%, a difference of 0.27%), Paraguayan (25.8%, a difference of 0.32%), and Sri Lankan (25.8%, a difference of 0.33%).
| Demographics | Rating | Rank | Wage/Income Gap |
| Immigrants | Greece | 56.6 /100 | #171 | Average 25.7% |
| Immigrants | Chile | 53.2 /100 | #172 | Average 25.7% |
| Immigrants | Belarus | 52.9 /100 | #173 | Average 25.7% |
| Alaskan Athabascans | 50.0 /100 | #174 | Average 25.8% |
| Sri Lankans | 47.0 /100 | #175 | Average 25.8% |
| Paraguayans | 46.7 /100 | #176 | Average 25.8% |
| Cambodians | 45.1 /100 | #177 | Average 25.8% |
| Chinese | 42.0 /100 | #178 | Average 25.9% |
| Samoans | 38.6 /100 | #179 | Fair 26.0% |
| Guamanians/Chamorros | 38.0 /100 | #180 | Fair 26.0% |
| Immigrants | Bolivia | 36.4 /100 | #181 | Fair 26.0% |
| Immigrants | Serbia | 35.4 /100 | #182 | Fair 26.0% |
| Immigrants | Kazakhstan | 35.2 /100 | #183 | Fair 26.0% |
| Mexicans | 34.4 /100 | #184 | Fair 26.0% |
| Pakistanis | 33.7 /100 | #185 | Fair 26.1% |