Colombian vs German Wage/Income Gap
COMPARE
Colombian
German
Wage/Income Gap
Wage/Income Gap Comparison
Colombians
Germans
24.7%
WAGE/INCOME GAP
92.4/ 100
METRIC RATING
133rd/ 347
METRIC RANK
29.2%
WAGE/INCOME GAP
0.0/ 100
METRIC RATING
330th/ 347
METRIC RANK
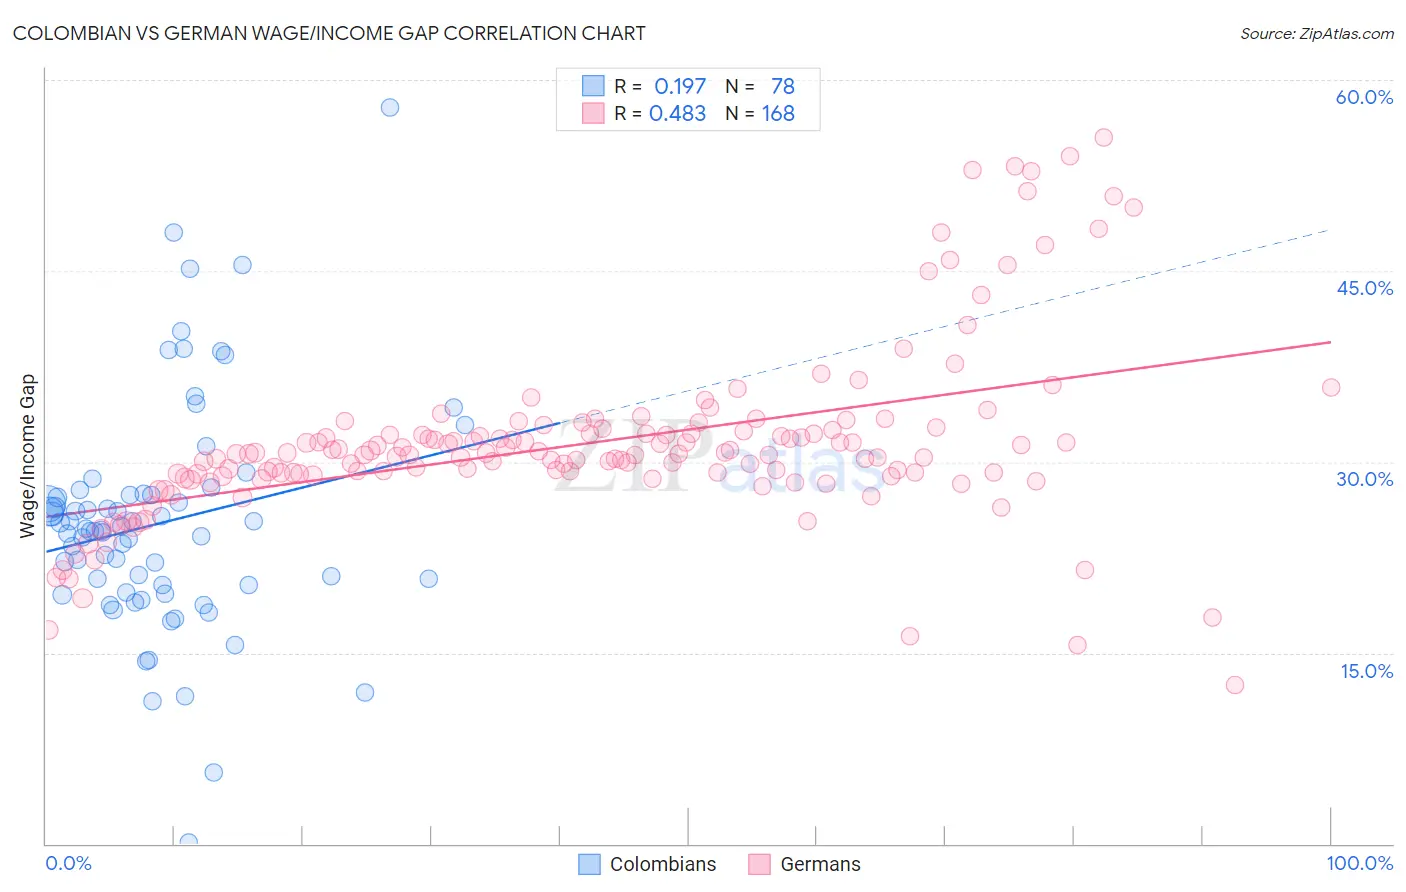
Colombian vs German Wage/Income Gap Correlation Chart
The statistical analysis conducted on geographies consisting of 419,429,082 people shows a poor positive correlation between the proportion of Colombians and wage/income gap percentage in the United States with a correlation coefficient (R) of 0.197 and weighted average of 24.7%. Similarly, the statistical analysis conducted on geographies consisting of 576,849,006 people shows a moderate positive correlation between the proportion of Germans and wage/income gap percentage in the United States with a correlation coefficient (R) of 0.483 and weighted average of 29.2%, a difference of 18.0%.
Wage/Income Gap Correlation Summary
| Measurement | Colombian | German |
| Minimum | 0.074% | 12.4% |
| Maximum | 57.8% | 55.5% |
| Range | 57.8% | 43.0% |
| Mean | 25.2% | 31.5% |
| Median | 24.6% | 30.6% |
| Interquartile 25% (IQ1) | 20.3% | 29.0% |
| Interquartile 75% (IQ3) | 27.4% | 32.3% |
| Interquartile Range (IQR) | 7.1% | 3.3% |
| Standard Deviation (Sample) | 9.1% | 7.0% |
| Standard Deviation (Population) | 9.0% | 7.0% |
Similar Demographics by Wage/Income Gap
Demographics Similar to Colombians by Wage/Income Gap
In terms of wage/income gap, the demographic groups most similar to Colombians are Immigrants from Costa Rica (24.7%, a difference of 0.0%), Mexican American Indian (24.7%, a difference of 0.030%), South American Indian (24.7%, a difference of 0.090%), Immigrants from Philippines (24.7%, a difference of 0.15%), and Alsatian (24.7%, a difference of 0.22%).
| Demographics | Rating | Rank | Wage/Income Gap |
| Immigrants | Uruguay | 93.8 /100 | #126 | Exceptional 24.6% |
| German Russians | 93.7 /100 | #127 | Exceptional 24.6% |
| Immigrants | Central America | 93.5 /100 | #128 | Exceptional 24.6% |
| Yup'ik | 93.3 /100 | #129 | Exceptional 24.7% |
| Alsatians | 93.2 /100 | #130 | Exceptional 24.7% |
| Immigrants | Philippines | 93.0 /100 | #131 | Exceptional 24.7% |
| Immigrants | Costa Rica | 92.4 /100 | #132 | Exceptional 24.7% |
| Colombians | 92.4 /100 | #133 | Exceptional 24.7% |
| Mexican American Indians | 92.2 /100 | #134 | Exceptional 24.7% |
| South American Indians | 92.0 /100 | #135 | Exceptional 24.7% |
| Armenians | 91.3 /100 | #136 | Exceptional 24.8% |
| Immigrants | South Eastern Asia | 90.9 /100 | #137 | Exceptional 24.8% |
| Immigrants | Bosnia and Herzegovina | 90.1 /100 | #138 | Exceptional 24.8% |
| Hispanics or Latinos | 89.5 /100 | #139 | Excellent 24.9% |
| Immigrants | Nepal | 89.3 /100 | #140 | Excellent 24.9% |
Demographics Similar to Germans by Wage/Income Gap
In terms of wage/income gap, the demographic groups most similar to Germans are Czech (29.2%, a difference of 0.050%), Scottish (29.1%, a difference of 0.10%), Scandinavian (29.1%, a difference of 0.24%), Immigrants from Iran (29.1%, a difference of 0.30%), and Immigrants from Belgium (29.0%, a difference of 0.41%).
| Demographics | Rating | Rank | Wage/Income Gap |
| Norwegians | 0.1 /100 | #323 | Tragic 29.0% |
| Croatians | 0.0 /100 | #324 | Tragic 29.0% |
| Hungarians | 0.0 /100 | #325 | Tragic 29.0% |
| Immigrants | Belgium | 0.0 /100 | #326 | Tragic 29.0% |
| Immigrants | Iran | 0.0 /100 | #327 | Tragic 29.1% |
| Scandinavians | 0.0 /100 | #328 | Tragic 29.1% |
| Scottish | 0.0 /100 | #329 | Tragic 29.1% |
| Germans | 0.0 /100 | #330 | Tragic 29.2% |
| Czechs | 0.0 /100 | #331 | Tragic 29.2% |
| Immigrants | South Central Asia | 0.0 /100 | #332 | Tragic 29.3% |
| Europeans | 0.0 /100 | #333 | Tragic 29.4% |
| Swedes | 0.0 /100 | #334 | Tragic 29.4% |
| Immigrants | Taiwan | 0.0 /100 | #335 | Tragic 29.5% |
| English | 0.0 /100 | #336 | Tragic 29.5% |
| Dutch | 0.0 /100 | #337 | Tragic 29.6% |