Yaqui vs Immigrants from Nigeria Median Female Earnings
COMPARE
Yaqui
Immigrants from Nigeria
Median Female Earnings
Median Female Earnings Comparison
Yaqui
Immigrants from Nigeria
$34,943
MEDIAN FEMALE EARNINGS
0.0/ 100
METRIC RATING
312th/ 347
METRIC RANK
$39,294
MEDIAN FEMALE EARNINGS
30.2/ 100
METRIC RATING
193rd/ 347
METRIC RANK
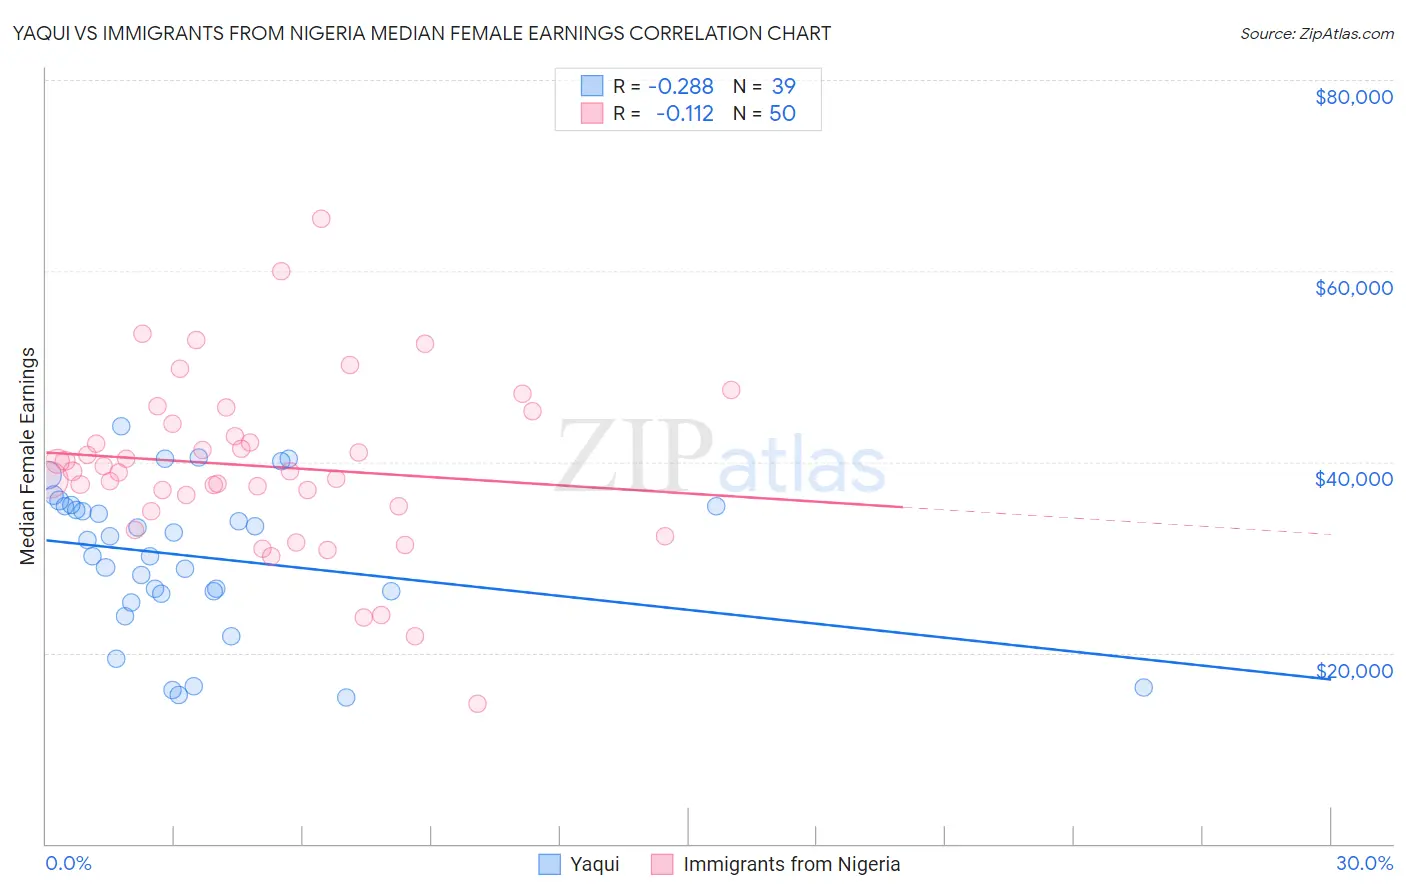
Yaqui vs Immigrants from Nigeria Median Female Earnings Correlation Chart
The statistical analysis conducted on geographies consisting of 107,698,351 people shows a weak negative correlation between the proportion of Yaqui and median female earnings in the United States with a correlation coefficient (R) of -0.288 and weighted average of $34,943. Similarly, the statistical analysis conducted on geographies consisting of 283,458,757 people shows a poor negative correlation between the proportion of Immigrants from Nigeria and median female earnings in the United States with a correlation coefficient (R) of -0.112 and weighted average of $39,294, a difference of 12.4%.
Median Female Earnings Correlation Summary
| Measurement | Yaqui | Immigrants from Nigeria |
| Minimum | $15,284 | $14,696 |
| Maximum | $43,787 | $65,528 |
| Range | $28,503 | $50,832 |
| Mean | $30,052 | $39,545 |
| Median | $31,854 | $39,021 |
| Interquartile 25% (IQ1) | $26,190 | $35,340 |
| Interquartile 75% (IQ3) | $35,336 | $44,001 |
| Interquartile Range (IQR) | $9,146 | $8,661 |
| Standard Deviation (Sample) | $7,719 | $9,154 |
| Standard Deviation (Population) | $7,619 | $9,062 |
Similar Demographics by Median Female Earnings
Demographics Similar to Yaqui by Median Female Earnings
In terms of median female earnings, the demographic groups most similar to Yaqui are Cuban ($34,942, a difference of 0.0%), Ute ($34,960, a difference of 0.050%), Apache ($34,895, a difference of 0.14%), Chippewa ($35,003, a difference of 0.17%), and Honduran ($35,013, a difference of 0.20%).
| Demographics | Rating | Rank | Median Female Earnings |
| Bahamians | 0.0 /100 | #305 | Tragic $35,125 |
| Fijians | 0.0 /100 | #306 | Tragic $35,114 |
| Sioux | 0.0 /100 | #307 | Tragic $35,063 |
| Immigrants | Bahamas | 0.0 /100 | #308 | Tragic $35,027 |
| Hondurans | 0.0 /100 | #309 | Tragic $35,013 |
| Chippewa | 0.0 /100 | #310 | Tragic $35,003 |
| Ute | 0.0 /100 | #311 | Tragic $34,960 |
| Yaqui | 0.0 /100 | #312 | Tragic $34,943 |
| Cubans | 0.0 /100 | #313 | Tragic $34,942 |
| Apache | 0.0 /100 | #314 | Tragic $34,895 |
| Pennsylvania Germans | 0.0 /100 | #315 | Tragic $34,802 |
| Cherokee | 0.0 /100 | #316 | Tragic $34,742 |
| Potawatomi | 0.0 /100 | #317 | Tragic $34,739 |
| Immigrants | Yemen | 0.0 /100 | #318 | Tragic $34,693 |
| Shoshone | 0.0 /100 | #319 | Tragic $34,677 |
Demographics Similar to Immigrants from Nigeria by Median Female Earnings
In terms of median female earnings, the demographic groups most similar to Immigrants from Nigeria are Irish ($39,291, a difference of 0.010%), Immigrants ($39,328, a difference of 0.090%), Immigrants from Western Africa ($39,351, a difference of 0.14%), Uruguayan ($39,228, a difference of 0.17%), and Puget Sound Salish ($39,376, a difference of 0.21%).
| Demographics | Rating | Rank | Median Female Earnings |
| Colombians | 36.9 /100 | #186 | Fair $39,439 |
| Swedes | 36.0 /100 | #187 | Fair $39,421 |
| Bermudans | 35.9 /100 | #188 | Fair $39,418 |
| Senegalese | 34.2 /100 | #189 | Fair $39,384 |
| Puget Sound Salish | 33.9 /100 | #190 | Fair $39,376 |
| Immigrants | Western Africa | 32.7 /100 | #191 | Fair $39,351 |
| Immigrants | Immigrants | 31.7 /100 | #192 | Fair $39,328 |
| Immigrants | Nigeria | 30.2 /100 | #193 | Fair $39,294 |
| Irish | 30.0 /100 | #194 | Fair $39,291 |
| Uruguayans | 27.3 /100 | #195 | Fair $39,228 |
| Immigrants | Costa Rica | 25.6 /100 | #196 | Fair $39,186 |
| Assyrians/Chaldeans/Syriacs | 24.6 /100 | #197 | Fair $39,159 |
| Ecuadorians | 23.0 /100 | #198 | Fair $39,117 |
| Icelanders | 22.7 /100 | #199 | Fair $39,109 |
| Immigrants | Panama | 20.6 /100 | #200 | Fair $39,049 |