Immigrants from Ukraine vs Immigrants from Nicaragua Median Female Earnings
COMPARE
Immigrants from Ukraine
Immigrants from Nicaragua
Median Female Earnings
Median Female Earnings Comparison
Immigrants from Ukraine
Immigrants from Nicaragua
$43,069
MEDIAN FEMALE EARNINGS
99.9/ 100
METRIC RATING
63rd/ 347
METRIC RANK
$36,023
MEDIAN FEMALE EARNINGS
0.0/ 100
METRIC RATING
287th/ 347
METRIC RANK
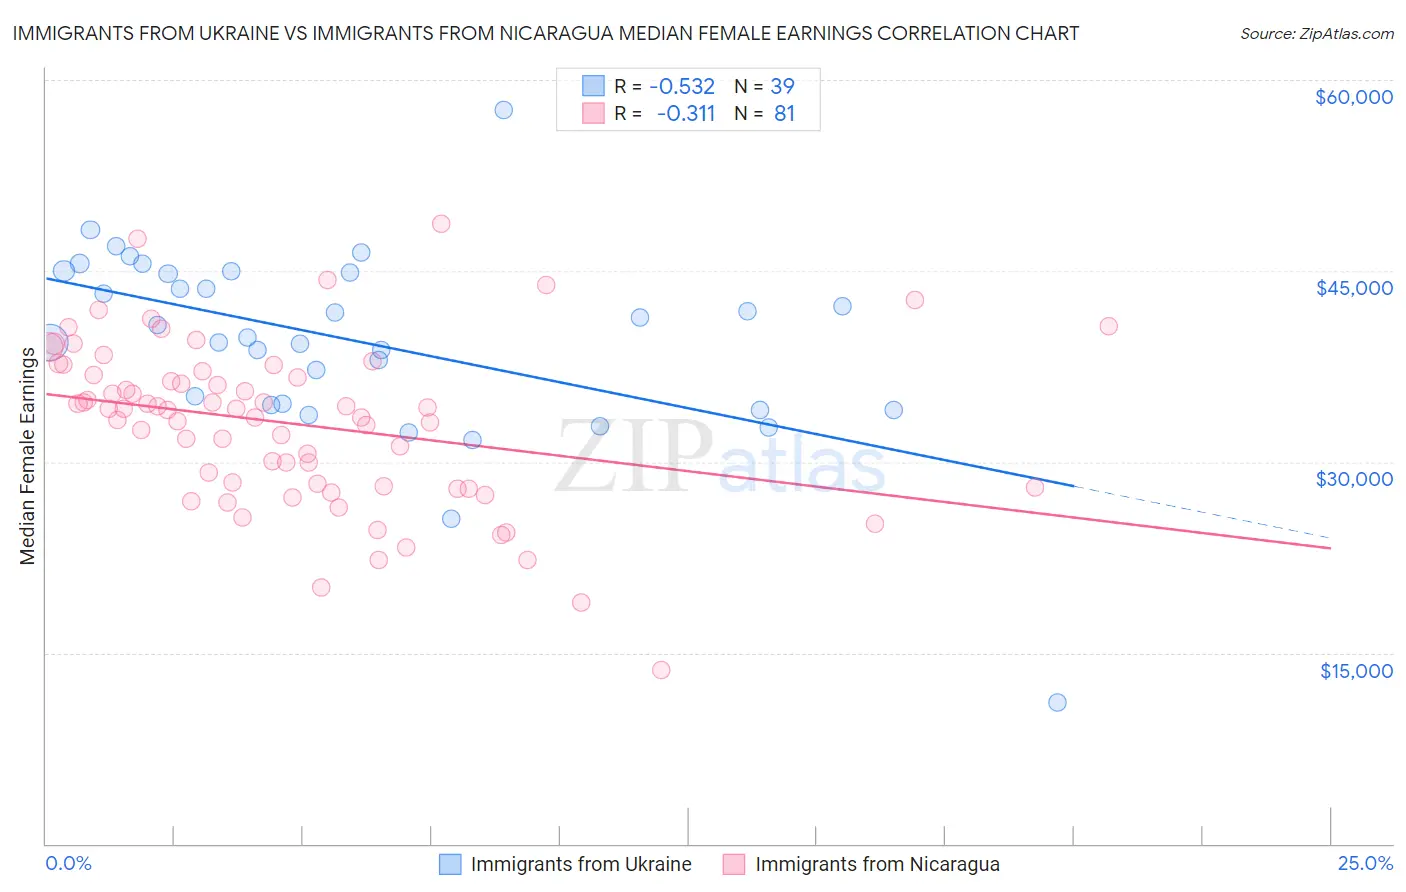
Immigrants from Ukraine vs Immigrants from Nicaragua Median Female Earnings Correlation Chart
The statistical analysis conducted on geographies consisting of 289,632,492 people shows a substantial negative correlation between the proportion of Immigrants from Ukraine and median female earnings in the United States with a correlation coefficient (R) of -0.532 and weighted average of $43,069. Similarly, the statistical analysis conducted on geographies consisting of 236,298,559 people shows a mild negative correlation between the proportion of Immigrants from Nicaragua and median female earnings in the United States with a correlation coefficient (R) of -0.311 and weighted average of $36,023, a difference of 19.6%.
Median Female Earnings Correlation Summary
| Measurement | Immigrants from Ukraine | Immigrants from Nicaragua |
| Minimum | $11,071 | $13,608 |
| Maximum | $57,684 | $48,676 |
| Range | $46,613 | $35,068 |
| Mean | $39,415 | $32,980 |
| Median | $39,738 | $34,129 |
| Interquartile 25% (IQ1) | $34,500 | $28,072 |
| Interquartile 75% (IQ3) | $44,923 | $36,975 |
| Interquartile Range (IQR) | $10,424 | $8,904 |
| Standard Deviation (Sample) | $7,597 | $6,452 |
| Standard Deviation (Population) | $7,499 | $6,412 |
Similar Demographics by Median Female Earnings
Demographics Similar to Immigrants from Ukraine by Median Female Earnings
In terms of median female earnings, the demographic groups most similar to Immigrants from Ukraine are Afghan ($43,077, a difference of 0.020%), Immigrants from Bulgaria ($43,085, a difference of 0.040%), Immigrants from Pakistan ($43,052, a difference of 0.040%), Immigrants from Latvia ($43,099, a difference of 0.070%), and Estonian ($43,106, a difference of 0.090%).
| Demographics | Rating | Rank | Median Female Earnings |
| Immigrants | Croatia | 99.9 /100 | #56 | Exceptional $43,258 |
| Ethiopians | 99.9 /100 | #57 | Exceptional $43,243 |
| Paraguayans | 99.9 /100 | #58 | Exceptional $43,173 |
| Estonians | 99.9 /100 | #59 | Exceptional $43,106 |
| Immigrants | Latvia | 99.9 /100 | #60 | Exceptional $43,099 |
| Immigrants | Bulgaria | 99.9 /100 | #61 | Exceptional $43,085 |
| Afghans | 99.9 /100 | #62 | Exceptional $43,077 |
| Immigrants | Ukraine | 99.9 /100 | #63 | Exceptional $43,069 |
| Immigrants | Pakistan | 99.9 /100 | #64 | Exceptional $43,052 |
| Sierra Leoneans | 99.9 /100 | #65 | Exceptional $42,868 |
| Immigrants | Norway | 99.9 /100 | #66 | Exceptional $42,837 |
| Immigrants | Egypt | 99.9 /100 | #67 | Exceptional $42,837 |
| Immigrants | Austria | 99.8 /100 | #68 | Exceptional $42,824 |
| Immigrants | Spain | 99.8 /100 | #69 | Exceptional $42,815 |
| Immigrants | Ethiopia | 99.8 /100 | #70 | Exceptional $42,744 |
Demographics Similar to Immigrants from Nicaragua by Median Female Earnings
In terms of median female earnings, the demographic groups most similar to Immigrants from Nicaragua are Immigrants from Zaire ($36,017, a difference of 0.020%), Osage ($36,034, a difference of 0.030%), Paiute ($36,056, a difference of 0.090%), Bangladeshi ($35,960, a difference of 0.17%), and Central American Indian ($35,930, a difference of 0.26%).
| Demographics | Rating | Rank | Median Female Earnings |
| Iroquois | 0.1 /100 | #280 | Tragic $36,408 |
| Spanish Americans | 0.1 /100 | #281 | Tragic $36,391 |
| Haitians | 0.1 /100 | #282 | Tragic $36,374 |
| Immigrants | Haiti | 0.1 /100 | #283 | Tragic $36,203 |
| Indonesians | 0.1 /100 | #284 | Tragic $36,140 |
| Paiute | 0.1 /100 | #285 | Tragic $36,056 |
| Osage | 0.0 /100 | #286 | Tragic $36,034 |
| Immigrants | Nicaragua | 0.0 /100 | #287 | Tragic $36,023 |
| Immigrants | Zaire | 0.0 /100 | #288 | Tragic $36,017 |
| Bangladeshis | 0.0 /100 | #289 | Tragic $35,960 |
| Central American Indians | 0.0 /100 | #290 | Tragic $35,930 |
| Blackfeet | 0.0 /100 | #291 | Tragic $35,864 |
| Americans | 0.0 /100 | #292 | Tragic $35,777 |
| Guatemalans | 0.0 /100 | #293 | Tragic $35,695 |
| Cheyenne | 0.0 /100 | #294 | Tragic $35,673 |