Choctaw vs Immigrants from China No Schooling Completed
COMPARE
Choctaw
Immigrants from China
No Schooling Completed
No Schooling Completed Comparison
Choctaw
Immigrants from China
1.8%
NO SCHOOLING COMPLETED
98.1/ 100
METRIC RATING
99th/ 347
METRIC RANK
2.6%
NO SCHOOLING COMPLETED
0.1/ 100
METRIC RATING
275th/ 347
METRIC RANK
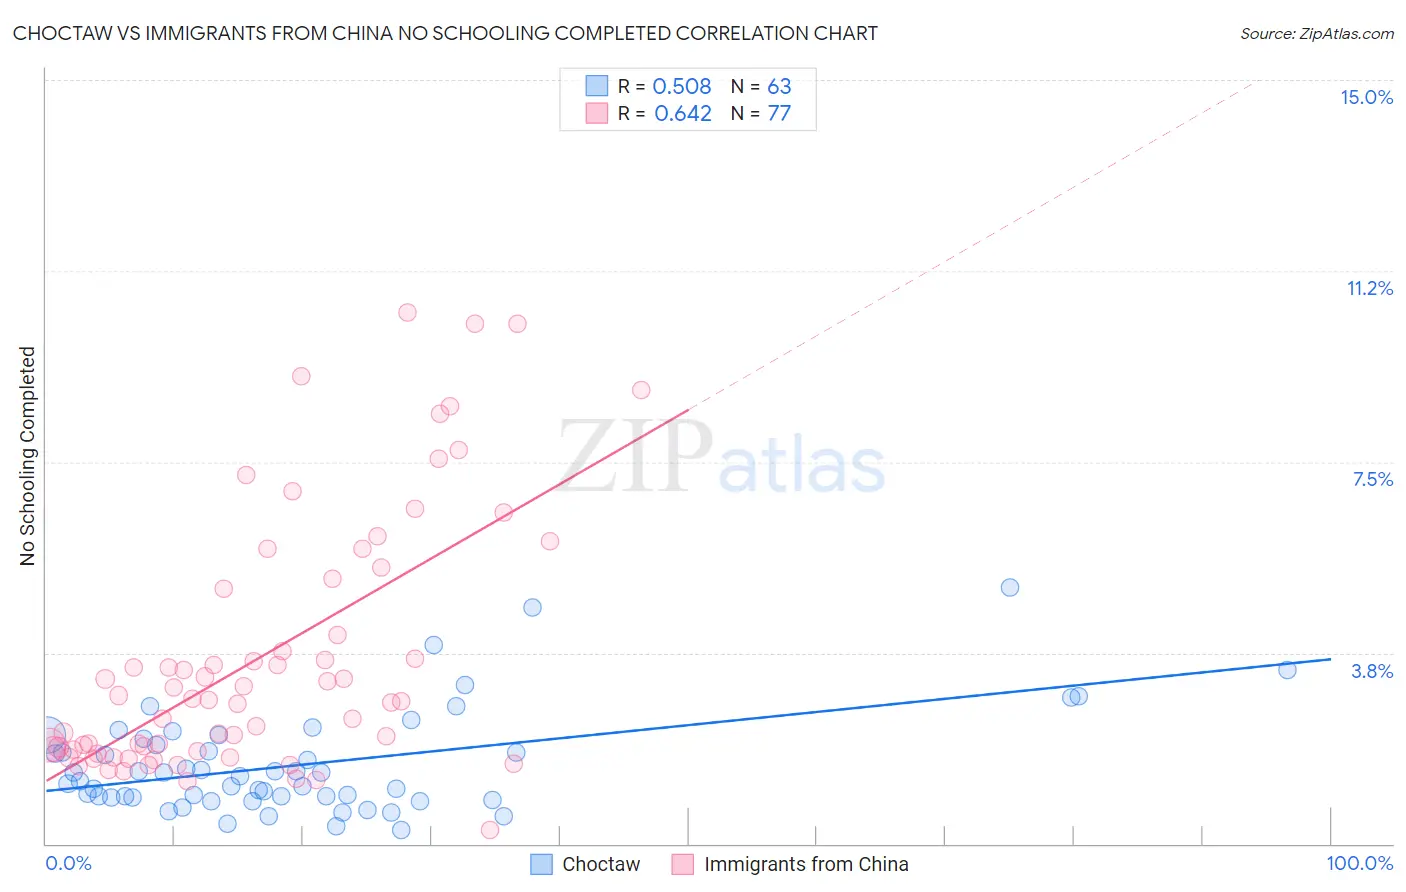
Choctaw vs Immigrants from China No Schooling Completed Correlation Chart
The statistical analysis conducted on geographies consisting of 267,452,860 people shows a substantial positive correlation between the proportion of Choctaw and percentage of population with no schooling in the United States with a correlation coefficient (R) of 0.508 and weighted average of 1.8%. Similarly, the statistical analysis conducted on geographies consisting of 450,744,905 people shows a significant positive correlation between the proportion of Immigrants from China and percentage of population with no schooling in the United States with a correlation coefficient (R) of 0.642 and weighted average of 2.6%, a difference of 41.4%.
No Schooling Completed Correlation Summary
| Measurement | Choctaw | Immigrants from China |
| Minimum | 0.27% | 0.26% |
| Maximum | 5.0% | 10.4% |
| Range | 4.8% | 10.2% |
| Mean | 1.6% | 3.6% |
| Median | 1.3% | 2.8% |
| Interquartile 25% (IQ1) | 0.92% | 1.8% |
| Interquartile 75% (IQ3) | 2.1% | 5.1% |
| Interquartile Range (IQR) | 1.1% | 3.3% |
| Standard Deviation (Sample) | 0.99% | 2.5% |
| Standard Deviation (Population) | 0.98% | 2.5% |
Similar Demographics by No Schooling Completed
Demographics Similar to Choctaw by No Schooling Completed
In terms of no schooling completed, the demographic groups most similar to Choctaw are Iranian (1.8%, a difference of 0.19%), Immigrants from Singapore (1.8%, a difference of 0.20%), Immigrants from Ireland (1.8%, a difference of 0.47%), Immigrants from Czechoslovakia (1.8%, a difference of 0.49%), and Immigrants from Switzerland (1.8%, a difference of 0.50%).
| Demographics | Rating | Rank | No Schooling Completed |
| Romanians | 98.8 /100 | #92 | Exceptional 1.8% |
| Turks | 98.7 /100 | #93 | Exceptional 1.8% |
| Immigrants | Nonimmigrants | 98.5 /100 | #94 | Exceptional 1.8% |
| Puget Sound Salish | 98.5 /100 | #95 | Exceptional 1.8% |
| Bhutanese | 98.4 /100 | #96 | Exceptional 1.8% |
| Immigrants | Ireland | 98.4 /100 | #97 | Exceptional 1.8% |
| Iranians | 98.2 /100 | #98 | Exceptional 1.8% |
| Choctaw | 98.1 /100 | #99 | Exceptional 1.8% |
| Immigrants | Singapore | 98.0 /100 | #100 | Exceptional 1.8% |
| Immigrants | Czechoslovakia | 97.9 /100 | #101 | Exceptional 1.8% |
| Immigrants | Switzerland | 97.9 /100 | #102 | Exceptional 1.8% |
| Basques | 97.9 /100 | #103 | Exceptional 1.8% |
| Thais | 97.5 /100 | #104 | Exceptional 1.8% |
| German Russians | 97.5 /100 | #105 | Exceptional 1.8% |
| Immigrants | France | 97.3 /100 | #106 | Exceptional 1.8% |
Demographics Similar to Immigrants from China by No Schooling Completed
In terms of no schooling completed, the demographic groups most similar to Immigrants from China are Ghanaian (2.6%, a difference of 0.18%), Immigrants from Cameroon (2.5%, a difference of 0.56%), Immigrants from Western Africa (2.6%, a difference of 0.56%), Immigrants from Philippines (2.6%, a difference of 0.61%), and Immigrants from Uzbekistan (2.6%, a difference of 0.81%).
| Demographics | Rating | Rank | No Schooling Completed |
| Taiwanese | 0.3 /100 | #268 | Tragic 2.5% |
| Immigrants | Nigeria | 0.2 /100 | #269 | Tragic 2.5% |
| Immigrants | Peru | 0.2 /100 | #270 | Tragic 2.5% |
| Cubans | 0.2 /100 | #271 | Tragic 2.5% |
| Immigrants | Bolivia | 0.2 /100 | #272 | Tragic 2.5% |
| Immigrants | Cameroon | 0.1 /100 | #273 | Tragic 2.5% |
| Ghanaians | 0.1 /100 | #274 | Tragic 2.6% |
| Immigrants | China | 0.1 /100 | #275 | Tragic 2.6% |
| Immigrants | Western Africa | 0.1 /100 | #276 | Tragic 2.6% |
| Immigrants | Philippines | 0.1 /100 | #277 | Tragic 2.6% |
| Immigrants | Uzbekistan | 0.1 /100 | #278 | Tragic 2.6% |
| Barbadians | 0.1 /100 | #279 | Tragic 2.6% |
| Trinidadians and Tobagonians | 0.1 /100 | #280 | Tragic 2.6% |
| Afghans | 0.1 /100 | #281 | Tragic 2.6% |
| Immigrants | Ghana | 0.1 /100 | #282 | Tragic 2.6% |