Immigrants from Czechoslovakia vs Estonian Median Female Earnings

COMPARE

Immigrants from Czechoslovakia
Race
Ancestry
AfghanAfricanAlaska NativeAlaskan AthabascanAlbanianAleutAlsatianAmericanApacheArabArapahoArgentineanArmenianAssyrian/Chaldean/SyriacAustralianAustrianBahamianBangladeshiBarbadianBasqueBelgianBelizeanBermudanBhutaneseBlackfeetBolivianBrazilianBritishBritish West IndianBulgarianBurmeseCajunCambodianCanadianCape VerdeanCarpatho RusynCelticCentral AmericanCentral American IndianCherokeeCheyenneChickasawChileanChineseChippewaChoctawColombianColvilleComancheCosta RicanCreeCreekCroatianCrowCubanCypriotCzechCzechoslovakianDanishDelawareDominicanDutchDutch West IndianEastern EuropeanEcuadorianEgyptianEnglishEthiopianEuropeanFijianFilipinoFinnishFrenchFrench American IndianFrench CanadianGermanGerman RussianGhanaianGreekGuamanian/ChamorroGuatemalanGuyaneseHaitianHmongHonduranHopiHoumaHungarianIcelanderIndian (Asian)IndonesianInupiatIranianIraqiIrishIroquoisIsraeliItalianJamaicanJapaneseJordanianKenyanKiowaKoreanLaotianLatvianLebaneseLiberianLithuanianLumbeeLuxembourgerMacedonianMalaysianMalteseMarshalleseMenomineeMexicanMexican American IndianMongolianMoroccanNative HawaiianNavajoNepaleseNew ZealanderNicaraguanNigerianNorthern EuropeanNorwegianOkinawanOsageOttawaPaiutePakistaniPalestinianPanamanianParaguayanPennsylvania GermanPeruvianPimaPolishPortuguesePotawatomiPuebloPuerto RicanPuget Sound SalishRomanianRussianSalvadoranSamoanScandinavianScotch-IrishScottishSeminoleSenegaleseSerbianShoshoneSierra LeoneanSiouxSlavicSlovakSloveneSomaliSouth AfricanSouth AmericanSouth American IndianSoviet UnionSpaniardSpanishSpanish AmericanSpanish American IndianSri LankanSubsaharan AfricanSudaneseSwedishSwissSyrianTaiwaneseThaiTlingit-HaidaTohono O'OdhamTonganTrinidadian and TobagonianTsimshianTurkishU.S. Virgin IslanderUgandanUkrainianUruguayanUteVenezuelanVietnameseWelshWest IndianYakamaYaquiYugoslavianYumanYup'ikZimbabwean
Immigration
NonimmigrantsImmigrantsAfghanistanAfricaAlbaniaArgentinaArmeniaAsiaAustraliaAustriaBahamasBangladeshBarbadosBelarusBelgiumBelizeBoliviaBosnia and HerzegovinaBrazilBulgariaBurma/MyanmarCabo VerdeCambodiaCameroonCanadaCaribbeanCentral AmericaChileChinaColombiaCongoCosta RicaCroatiaCubaCzechoslovakiaDenmarkDominicaDominican RepublicEastern AfricaEastern AsiaEastern EuropeEcuadorEgyptEl SalvadorEnglandEritreaEthiopiaEuropeFijiFranceGermanyGhanaGreeceGrenadaGuatemalaGuyanaHaitiHondurasHong KongHungaryIndiaIndonesiaIranIraqIrelandIsraelItalyJamaicaJapanJordanKazakhstanKenyaKoreaKuwaitLaosLatin AmericaLatviaLebanonLiberiaLithuaniaMalaysiaMexicoMicronesiaMiddle AfricaMoldovaMoroccoNepalNetherlandsNicaraguaNigeriaNorth AmericaNorth MacedoniaNorthern AfricaNorthern EuropeNorwayOceaniaPakistanPanamaPeruPhilippinesPolandPortugalRomaniaRussiaSaudi ArabiaScotlandSenegalSerbiaSierra LeoneSingaporeSomaliaSouth AfricaSouth AmericaSouth Central AsiaSouth Eastern AsiaSouthern EuropeSpainSri LankaSt. Vincent and the GrenadinesSudanSwedenSwitzerlandSyriaTaiwanThailandTrinidad and TobagoTurkeyUgandaUkraineUruguayUzbekistanVenezuelaVietnamWest IndiesWestern AfricaWestern AsiaWestern EuropeYemenZaireZimbabweAzores
Estonian
Race
Ancestry
AfghanAfricanAlaska NativeAlaskan AthabascanAlbanianAleutAlsatianAmericanApacheArabArapahoArgentineanArmenianAssyrian/Chaldean/SyriacAustralianAustrianBahamianBangladeshiBarbadianBasqueBelgianBelizeanBermudanBhutaneseBlackfeetBolivianBrazilianBritishBritish West IndianBulgarianBurmeseCajunCambodianCanadianCape VerdeanCarpatho RusynCelticCentral AmericanCentral American IndianCherokeeCheyenneChickasawChileanChineseChippewaChoctawColombianColvilleComancheCosta RicanCreeCreekCroatianCrowCubanCypriotCzechCzechoslovakianDanishDelawareDominicanDutchDutch West IndianEastern EuropeanEcuadorianEgyptianEnglishEstonianEthiopianEuropeanFijianFilipinoFinnishFrenchFrench American IndianFrench CanadianGermanGerman RussianGhanaianGreekGuamanian/ChamorroGuatemalanGuyaneseHaitianHmongHonduranHopiHoumaHungarianIcelanderIndian (Asian)IndonesianInupiatIranianIraqiIrishIroquoisIsraeliItalianJamaicanJapaneseJordanianKenyanKiowaKoreanLaotianLatvianLebaneseLiberianLithuanianLumbeeLuxembourgerMacedonianMalaysianMalteseMarshalleseMenomineeMexicanMexican American IndianMongolianMoroccanNative HawaiianNavajoNepaleseNew ZealanderNicaraguanNigerianNorthern EuropeanNorwegianOkinawanOsageOttawaPaiutePakistaniPalestinianPanamanianParaguayanPennsylvania GermanPeruvianPimaPolishPortuguesePotawatomiPuebloPuerto RicanPuget Sound SalishRomanianRussianSalvadoranSamoanScandinavianScotch-IrishScottishSeminoleSenegaleseSerbianShoshoneSierra LeoneanSiouxSlavicSlovakSloveneSomaliSouth AfricanSouth AmericanSouth American IndianSoviet UnionSpaniardSpanishSpanish AmericanSpanish American IndianSri LankanSubsaharan AfricanSudaneseSwedishSwissSyrianTaiwaneseThaiTlingit-HaidaTohono O'OdhamTonganTrinidadian and TobagonianTsimshianTurkishU.S. Virgin IslanderUgandanUkrainianUruguayanUteVenezuelanVietnameseWelshWest IndianYakamaYaquiYugoslavianYumanYup'ikZimbabwean
Immigration
NonimmigrantsImmigrantsAfghanistanAfricaAlbaniaArgentinaArmeniaAsiaAustraliaAustriaBahamasBangladeshBarbadosBelarusBelgiumBelizeBoliviaBosnia and HerzegovinaBrazilBulgariaBurma/MyanmarCabo VerdeCambodiaCameroonCanadaCaribbeanCentral AmericaChileChinaColombiaCongoCosta RicaCroatiaCubaDenmarkDominicaDominican RepublicEastern AfricaEastern AsiaEastern EuropeEcuadorEgyptEl SalvadorEnglandEritreaEthiopiaEuropeFijiFranceGermanyGhanaGreeceGrenadaGuatemalaGuyanaHaitiHondurasHong KongHungaryIndiaIndonesiaIranIraqIrelandIsraelItalyJamaicaJapanJordanKazakhstanKenyaKoreaKuwaitLaosLatin AmericaLatviaLebanonLiberiaLithuaniaMalaysiaMexicoMicronesiaMiddle AfricaMoldovaMoroccoNepalNetherlandsNicaraguaNigeriaNorth AmericaNorth MacedoniaNorthern AfricaNorthern EuropeNorwayOceaniaPakistanPanamaPeruPhilippinesPolandPortugalRomaniaRussiaSaudi ArabiaScotlandSenegalSerbiaSierra LeoneSingaporeSomaliaSouth AfricaSouth AmericaSouth Central AsiaSouth Eastern AsiaSouthern EuropeSpainSri LankaSt. Vincent and the GrenadinesSudanSwedenSwitzerlandSyriaTaiwanThailandTrinidad and TobagoTurkeyUgandaUkraineUruguayUzbekistanVenezuelaVietnamWest IndiesWestern AfricaWestern AsiaWestern EuropeYemenZaireZimbabweAzores
Median Female Earnings
Income
Poverty
Unemployment
Labor Participation
Family Structure
Vehicle Availability
Education Level
Disability

Median Female Earnings Comparison

Immigrants from Czechoslovakia

Estonians

Exceptional
Exceptional
$43,571
MEDIAN FEMALE EARNINGS
100.0/ 100
METRIC RATING
44th/ 347
METRIC RANK
$43,106
MEDIAN FEMALE EARNINGS
99.9/ 100
METRIC RATING
59th/ 347
METRIC RANK

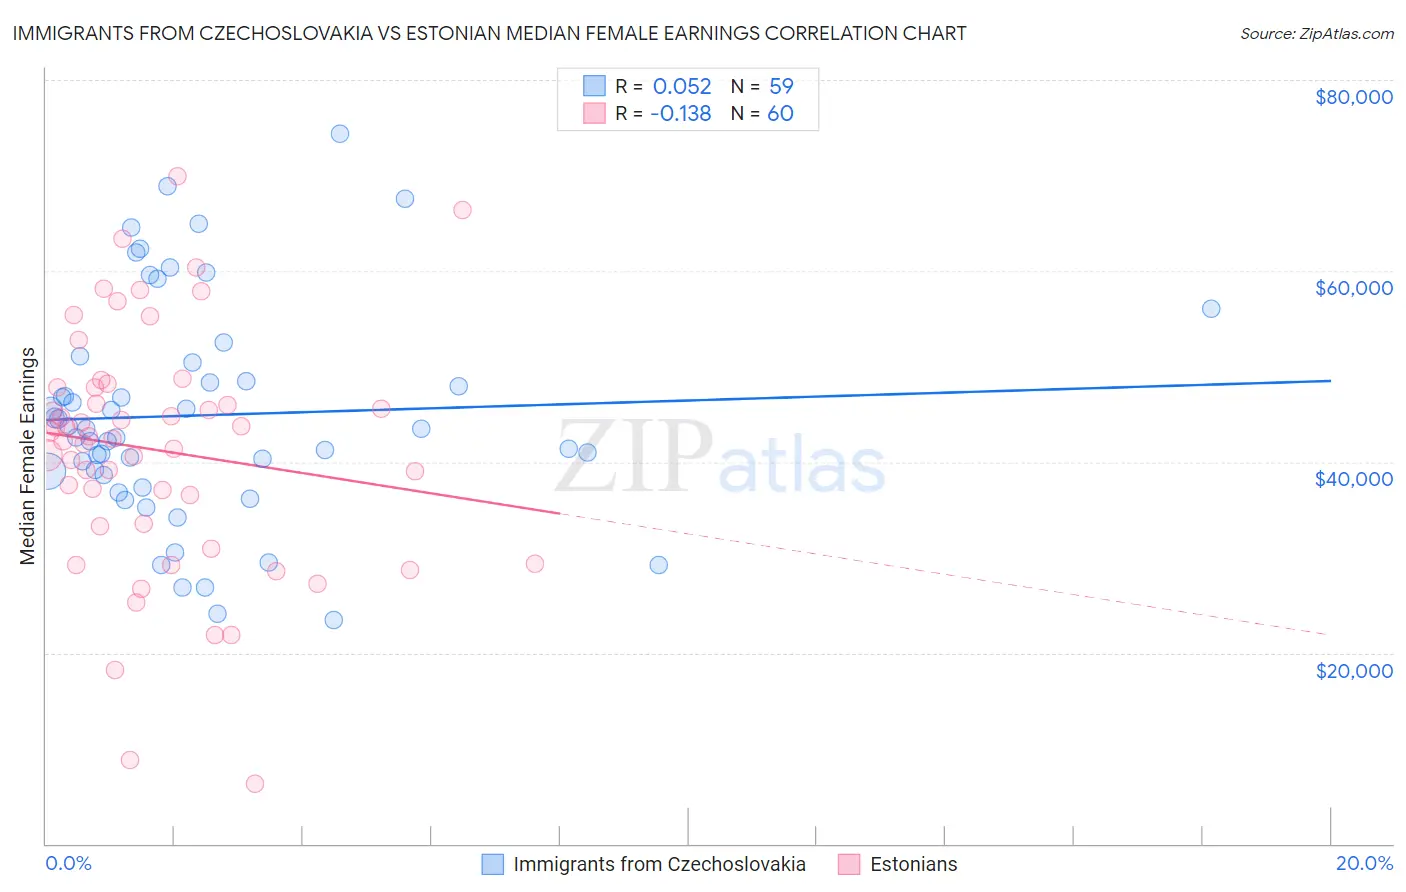
Immigrants from Czechoslovakia vs Estonian Median Female Earnings Correlation Chart

The statistical analysis conducted on geographies consisting of 195,434,199 people shows a slight positive correlation between the proportion of Immigrants from Czechoslovakia and median female earnings in the United States with a correlation coefficient (R) of 0.052 and weighted average of $43,571. Similarly, the statistical analysis conducted on geographies consisting of 123,507,211 people shows a poor negative correlation between the proportion of Estonians and median female earnings in the United States with a correlation coefficient (R) of -0.138 and weighted average of $43,106, a difference of 1.1%.
Immigrants from Czechoslovakia vs Estonian Median Female Earnings

Median Female Earnings Correlation Summary

MeasurementImmigrants from CzechoslovakiaEstonian
Minimum$23,424$6,250
Maximum$74,375$69,908
Range$50,951$63,658
Mean$44,894$41,197
Median$43,456$42,543
Interquartile 25% (IQ1)$38,665$33,356
Interquartile 75% (IQ3)$50,450$47,750
Interquartile Range (IQR)$11,786$14,393
Standard Deviation (Sample)$11,575$12,774
Standard Deviation (Population)$11,476$12,667

Demographics Similar to Immigrants from Czechoslovakia and Estonians by Median Female Earnings

In terms of median female earnings, the demographic groups most similar to Immigrants from Czechoslovakia are Immigrants from Europe ($43,523, a difference of 0.11%), Bulgarian ($43,638, a difference of 0.15%), Immigrants from Denmark ($43,646, a difference of 0.17%), Bhutanese ($43,648, a difference of 0.18%), and Immigrants from Bolivia ($43,467, a difference of 0.24%). Similarly, the demographic groups most similar to Estonians are Immigrants from Latvia ($43,099, a difference of 0.020%), Immigrants from Bulgaria ($43,085, a difference of 0.050%), Paraguayan ($43,173, a difference of 0.16%), Ethiopian ($43,243, a difference of 0.32%), and Immigrants from Croatia ($43,258, a difference of 0.35%).
DemographicsRating | RankMedian Female Earnings
Bhutanese
100.0
/100
|
#41
Exceptional
$43,648
Immigrants | Denmark
100.0
/100
|
#42
Exceptional
$43,646
Bulgarians
100.0
/100
|
#43
Exceptional
$43,638
Immigrants | Czechoslovakia
100.0
/100
|
#44
Exceptional
$43,571
Immigrants | Europe
100.0
/100
|
#45
Exceptional
$43,523
Immigrants | Bolivia
100.0
/100
|
#46
Exceptional
$43,467
Bolivians
100.0
/100
|
#47
Exceptional
$43,445
Immigrants | Indonesia
100.0
/100
|
#48
Exceptional
$43,412
Immigrants | Serbia
100.0
/100
|
#49
Exceptional
$43,385
Immigrants | Uzbekistan
100.0
/100
|
#50
Exceptional
$43,363
Maltese
100.0
/100
|
#51
Exceptional
$43,357
Immigrants | Lithuania
99.9
/100
|
#52
Exceptional
$43,317
Immigrants | Eastern Europe
99.9
/100
|
#53
Exceptional
$43,309
Australians
99.9
/100
|
#54
Exceptional
$43,308
Egyptians
99.9
/100
|
#55
Exceptional
$43,305
Immigrants | Croatia
99.9
/100
|
#56
Exceptional
$43,258
Ethiopians
99.9
/100
|
#57
Exceptional
$43,243
Paraguayans
99.9
/100
|
#58
Exceptional
$43,173
Estonians
99.9
/100
|
#59
Exceptional
$43,106
Immigrants | Latvia
99.9
/100
|
#60
Exceptional
$43,099
Immigrants | Bulgaria
99.9
/100
|
#61
Exceptional
$43,085