Choctaw vs Estonian Single Male Poverty
COMPARE
Choctaw
Estonian
Single Male Poverty
Single Male Poverty Comparison
Choctaw
Estonians
17.0%
SINGLE MALE POVERTY
0.0/ 100
METRIC RATING
325th/ 347
METRIC RANK
13.0%
SINGLE MALE POVERTY
20.3/ 100
METRIC RATING
204th/ 347
METRIC RANK
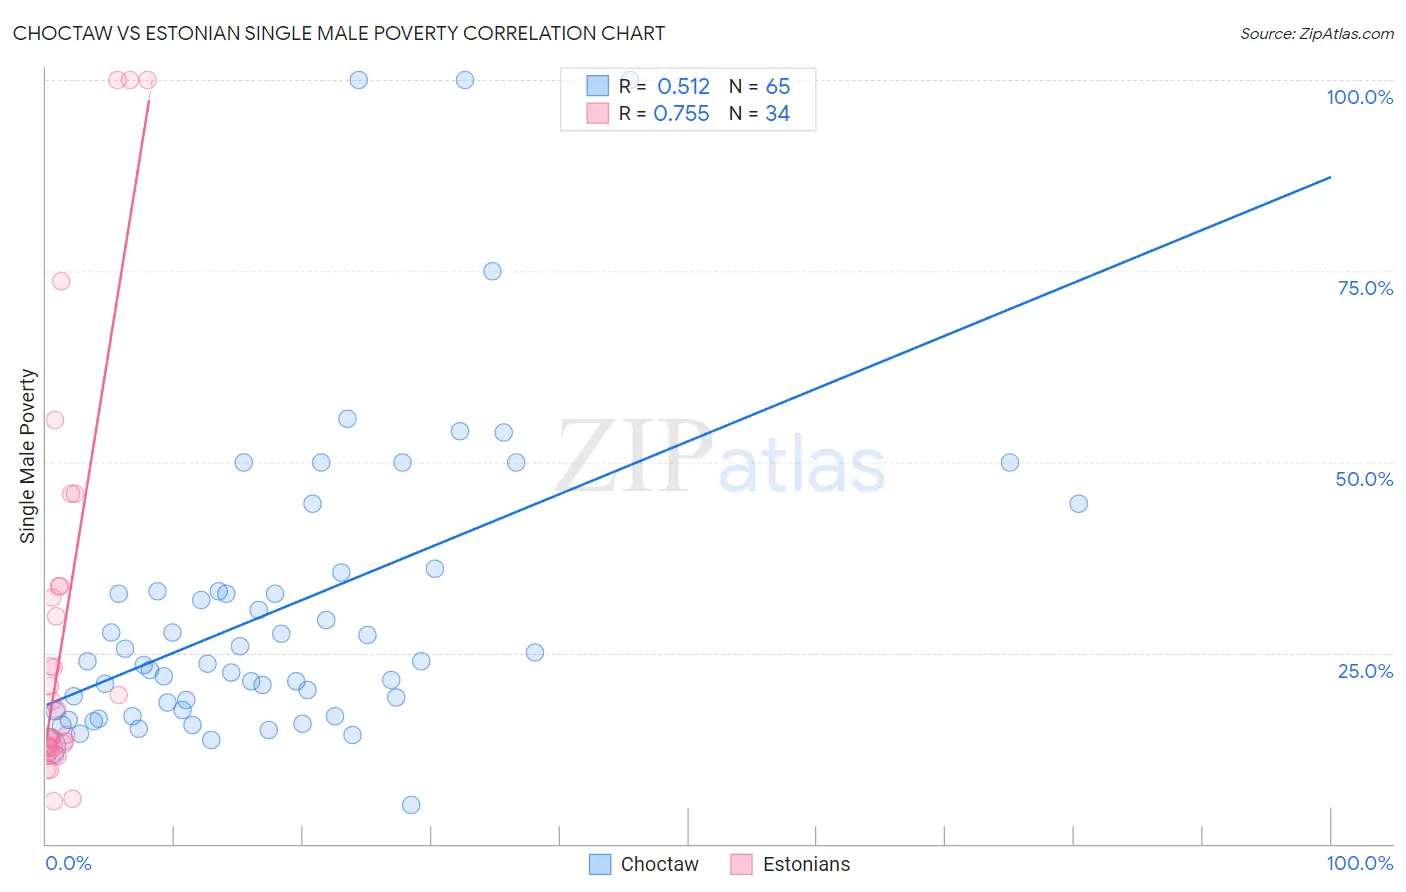
Choctaw vs Estonian Single Male Poverty Correlation Chart
The statistical analysis conducted on geographies consisting of 249,568,106 people shows a substantial positive correlation between the proportion of Choctaw and poverty level among single males in the United States with a correlation coefficient (R) of 0.512 and weighted average of 17.0%. Similarly, the statistical analysis conducted on geographies consisting of 115,524,258 people shows a strong positive correlation between the proportion of Estonians and poverty level among single males in the United States with a correlation coefficient (R) of 0.755 and weighted average of 13.0%, a difference of 30.3%.
Single Male Poverty Correlation Summary
| Measurement | Choctaw | Estonian |
| Minimum | 5.0% | 5.6% |
| Maximum | 100.0% | 100.0% |
| Range | 95.0% | 94.4% |
| Mean | 30.9% | 28.6% |
| Median | 23.9% | 15.9% |
| Interquartile 25% (IQ1) | 17.5% | 12.6% |
| Interquartile 75% (IQ3) | 34.3% | 33.7% |
| Interquartile Range (IQR) | 16.8% | 21.1% |
| Standard Deviation (Sample) | 20.3% | 27.0% |
| Standard Deviation (Population) | 20.1% | 26.6% |
Similar Demographics by Single Male Poverty
Demographics Similar to Choctaw by Single Male Poverty
In terms of single male poverty, the demographic groups most similar to Choctaw are Immigrants from Yemen (16.9%, a difference of 0.72%), Creek (16.8%, a difference of 0.83%), Central American Indian (17.2%, a difference of 1.6%), Shoshone (16.7%, a difference of 1.9%), and Osage (16.5%, a difference of 3.1%).
| Demographics | Rating | Rank | Single Male Poverty |
| Chickasaw | 0.0 /100 | #318 | Tragic 16.3% |
| Chippewa | 0.0 /100 | #319 | Tragic 16.4% |
| Marshallese | 0.0 /100 | #320 | Tragic 16.4% |
| Osage | 0.0 /100 | #321 | Tragic 16.5% |
| Shoshone | 0.0 /100 | #322 | Tragic 16.7% |
| Creek | 0.0 /100 | #323 | Tragic 16.8% |
| Immigrants | Yemen | 0.0 /100 | #324 | Tragic 16.9% |
| Choctaw | 0.0 /100 | #325 | Tragic 17.0% |
| Central American Indians | 0.0 /100 | #326 | Tragic 17.2% |
| Menominee | 0.0 /100 | #327 | Tragic 17.7% |
| Kiowa | 0.0 /100 | #328 | Tragic 18.3% |
| Colville | 0.0 /100 | #329 | Tragic 18.4% |
| Cajuns | 0.0 /100 | #330 | Tragic 19.1% |
| Paiute | 0.0 /100 | #331 | Tragic 19.3% |
| Natives/Alaskans | 0.0 /100 | #332 | Tragic 19.6% |
Demographics Similar to Estonians by Single Male Poverty
In terms of single male poverty, the demographic groups most similar to Estonians are Immigrants from Bangladesh (13.0%, a difference of 0.0%), Basque (13.0%, a difference of 0.030%), Polish (13.0%, a difference of 0.080%), Trinidadian and Tobagonian (13.0%, a difference of 0.090%), and Slovene (13.0%, a difference of 0.10%).
| Demographics | Rating | Rank | Single Male Poverty |
| Immigrants | Laos | 23.1 /100 | #197 | Fair 13.0% |
| Lithuanians | 22.1 /100 | #198 | Fair 13.0% |
| Immigrants | Norway | 21.8 /100 | #199 | Fair 13.0% |
| Slovenes | 21.6 /100 | #200 | Fair 13.0% |
| Trinidadians and Tobagonians | 21.4 /100 | #201 | Fair 13.0% |
| Basques | 20.7 /100 | #202 | Fair 13.0% |
| Immigrants | Bangladesh | 20.4 /100 | #203 | Fair 13.0% |
| Estonians | 20.3 /100 | #204 | Fair 13.0% |
| Poles | 19.3 /100 | #205 | Poor 13.0% |
| Northern Europeans | 18.9 /100 | #206 | Poor 13.0% |
| Sudanese | 17.7 /100 | #207 | Poor 13.1% |
| Immigrants | Western Africa | 17.6 /100 | #208 | Poor 13.1% |
| Mexican American Indians | 17.5 /100 | #209 | Poor 13.1% |
| Immigrants | Haiti | 16.8 /100 | #210 | Poor 13.1% |
| Swedes | 16.8 /100 | #211 | Poor 13.1% |