Choctaw vs Apache In Labor Force | Age 35-44
COMPARE
Choctaw
Apache
In Labor Force | Age 35-44
In Labor Force | Age 35-44 Comparison
Choctaw
Apache
80.5%
IN LABOR FORCE | AGE 35-44
0.0/ 100
METRIC RATING
324th/ 347
METRIC RANK
77.9%
IN LABOR FORCE | AGE 35-44
0.0/ 100
METRIC RATING
337th/ 347
METRIC RANK
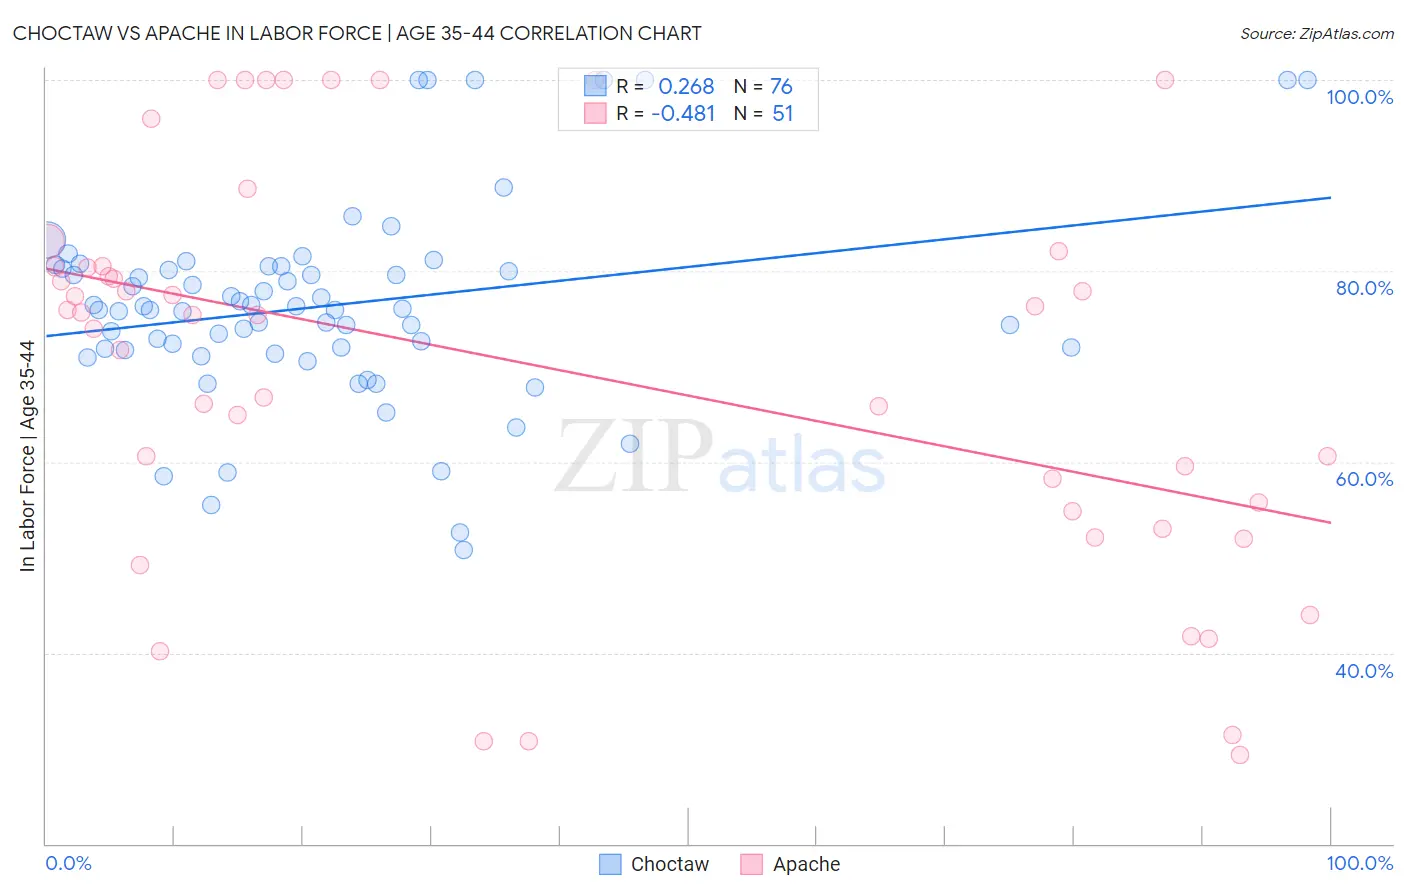
Choctaw vs Apache In Labor Force | Age 35-44 Correlation Chart
The statistical analysis conducted on geographies consisting of 269,650,989 people shows a weak positive correlation between the proportion of Choctaw and labor force participation rate among population between the ages 35 and 44 in the United States with a correlation coefficient (R) of 0.268 and weighted average of 80.5%. Similarly, the statistical analysis conducted on geographies consisting of 231,077,330 people shows a moderate negative correlation between the proportion of Apache and labor force participation rate among population between the ages 35 and 44 in the United States with a correlation coefficient (R) of -0.481 and weighted average of 77.9%, a difference of 3.4%.
In Labor Force | Age 35-44 Correlation Summary
| Measurement | Choctaw | Apache |
| Minimum | 50.8% | 29.3% |
| Maximum | 100.0% | 100.0% |
| Range | 49.2% | 70.7% |
| Mean | 76.4% | 70.1% |
| Median | 76.0% | 75.4% |
| Interquartile 25% (IQ1) | 71.8% | 54.8% |
| Interquartile 75% (IQ3) | 80.4% | 80.5% |
| Interquartile Range (IQR) | 8.5% | 25.7% |
| Standard Deviation (Sample) | 10.5% | 20.6% |
| Standard Deviation (Population) | 10.4% | 20.4% |
Demographics Similar to Choctaw and Apache by In Labor Force | Age 35-44
In terms of in labor force | age 35-44, the demographic groups most similar to Choctaw are Yaqui (80.5%, a difference of 0.010%), Paiute (80.6%, a difference of 0.13%), Dutch West Indian (80.4%, a difference of 0.15%), Puerto Rican (80.7%, a difference of 0.19%), and Seminole (80.4%, a difference of 0.19%). Similarly, the demographic groups most similar to Apache are Arapaho (78.1%, a difference of 0.21%), Pueblo (77.4%, a difference of 0.70%), Yup'ik (77.3%, a difference of 0.81%), Lumbee (77.0%, a difference of 1.2%), and Native/Alaskan (78.9%, a difference of 1.3%).
| Demographics | Rating | Rank | In Labor Force | Age 35-44 |
| Chickasaw | 0.0 /100 | #320 | Tragic 80.9% |
| Puerto Ricans | 0.0 /100 | #321 | Tragic 80.7% |
| Paiute | 0.0 /100 | #322 | Tragic 80.6% |
| Yaqui | 0.0 /100 | #323 | Tragic 80.5% |
| Choctaw | 0.0 /100 | #324 | Tragic 80.5% |
| Dutch West Indians | 0.0 /100 | #325 | Tragic 80.4% |
| Seminole | 0.0 /100 | #326 | Tragic 80.4% |
| Sioux | 0.0 /100 | #327 | Tragic 80.2% |
| Creek | 0.0 /100 | #328 | Tragic 80.0% |
| Menominee | 0.0 /100 | #329 | Tragic 79.7% |
| Cheyenne | 0.0 /100 | #330 | Tragic 79.5% |
| Houma | 0.0 /100 | #331 | Tragic 79.5% |
| Ute | 0.0 /100 | #332 | Tragic 79.4% |
| Kiowa | 0.0 /100 | #333 | Tragic 79.2% |
| Yakama | 0.0 /100 | #334 | Tragic 79.0% |
| Natives/Alaskans | 0.0 /100 | #335 | Tragic 78.9% |
| Arapaho | 0.0 /100 | #336 | Tragic 78.1% |
| Apache | 0.0 /100 | #337 | Tragic 77.9% |
| Pueblo | 0.0 /100 | #338 | Tragic 77.4% |
| Yup'ik | 0.0 /100 | #339 | Tragic 77.3% |
| Lumbee | 0.0 /100 | #340 | Tragic 77.0% |