Choctaw vs Apache Female Unemployment
COMPARE
Choctaw
Apache
Female Unemployment
Female Unemployment Comparison
Choctaw
Apache
5.4%
FEMALE UNEMPLOYMENT
12.3/ 100
METRIC RATING
210th/ 347
METRIC RANK
6.6%
FEMALE UNEMPLOYMENT
0.0/ 100
METRIC RATING
325th/ 347
METRIC RANK
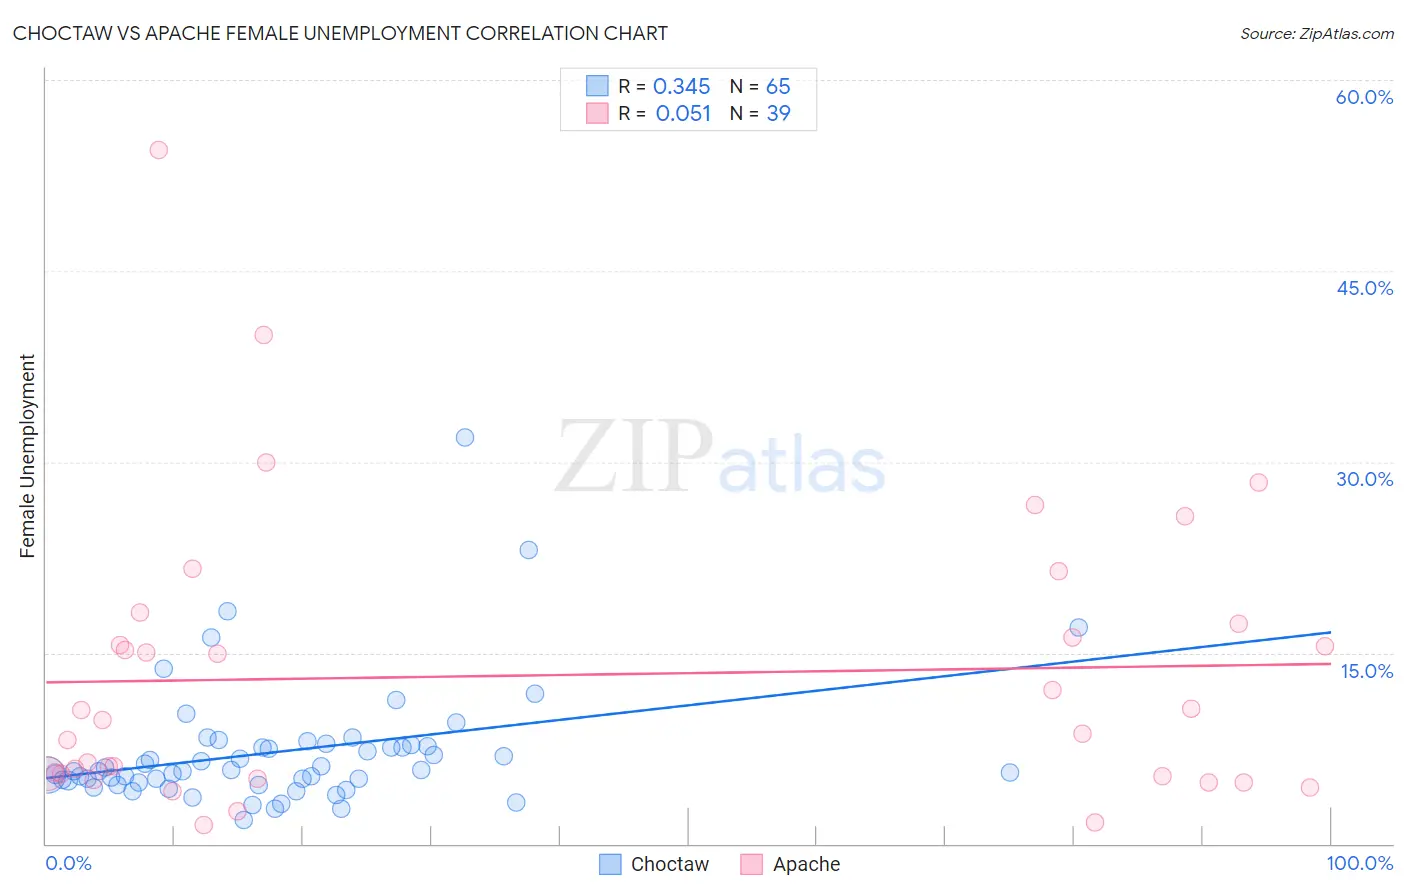
Choctaw vs Apache Female Unemployment Correlation Chart
The statistical analysis conducted on geographies consisting of 268,280,728 people shows a mild positive correlation between the proportion of Choctaw and unemploymnet rate among females in the United States with a correlation coefficient (R) of 0.345 and weighted average of 5.4%. Similarly, the statistical analysis conducted on geographies consisting of 230,279,610 people shows a slight positive correlation between the proportion of Apache and unemploymnet rate among females in the United States with a correlation coefficient (R) of 0.051 and weighted average of 6.6%, a difference of 21.7%.
Female Unemployment Correlation Summary
| Measurement | Choctaw | Apache |
| Minimum | 1.9% | 1.5% |
| Maximum | 31.9% | 54.5% |
| Range | 30.0% | 53.0% |
| Mean | 7.2% | 13.2% |
| Median | 5.7% | 9.7% |
| Interquartile 25% (IQ1) | 4.9% | 5.3% |
| Interquartile 75% (IQ3) | 7.7% | 17.3% |
| Interquartile Range (IQR) | 2.9% | 12.0% |
| Standard Deviation (Sample) | 4.9% | 11.3% |
| Standard Deviation (Population) | 4.9% | 11.1% |
Similar Demographics by Female Unemployment
Demographics Similar to Choctaw by Female Unemployment
In terms of female unemployment, the demographic groups most similar to Choctaw are Ottawa (5.4%, a difference of 0.10%), Uruguayan (5.4%, a difference of 0.12%), Korean (5.4%, a difference of 0.15%), Immigrants from Costa Rica (5.4%, a difference of 0.19%), and Samoan (5.4%, a difference of 0.23%).
| Demographics | Rating | Rank | Female Unemployment |
| Immigrants | South Eastern Asia | 20.3 /100 | #203 | Fair 5.4% |
| Immigrants | Israel | 19.7 /100 | #204 | Poor 5.4% |
| Immigrants | Afghanistan | 18.9 /100 | #205 | Poor 5.4% |
| Immigrants | Brazil | 18.8 /100 | #206 | Poor 5.4% |
| Creek | 15.4 /100 | #207 | Poor 5.4% |
| Immigrants | Costa Rica | 13.7 /100 | #208 | Poor 5.4% |
| Koreans | 13.4 /100 | #209 | Poor 5.4% |
| Choctaw | 12.3 /100 | #210 | Poor 5.4% |
| Ottawa | 11.6 /100 | #211 | Poor 5.4% |
| Uruguayans | 11.4 /100 | #212 | Poor 5.4% |
| Samoans | 10.6 /100 | #213 | Poor 5.4% |
| Seminole | 10.3 /100 | #214 | Poor 5.4% |
| Immigrants | Nicaragua | 10.2 /100 | #215 | Poor 5.4% |
| Comanche | 10.0 /100 | #216 | Poor 5.4% |
| Peruvians | 9.6 /100 | #217 | Tragic 5.4% |
Demographics Similar to Apache by Female Unemployment
In terms of female unemployment, the demographic groups most similar to Apache are Cheyenne (6.6%, a difference of 0.27%), Native/Alaskan (6.6%, a difference of 0.56%), Alaska Native (6.6%, a difference of 0.64%), Guyanese (6.7%, a difference of 1.1%), and Immigrants from Belize (6.5%, a difference of 1.3%).
| Demographics | Rating | Rank | Female Unemployment |
| British West Indians | 0.0 /100 | #318 | Tragic 6.4% |
| Immigrants | Bangladesh | 0.0 /100 | #319 | Tragic 6.5% |
| Immigrants | Dominica | 0.0 /100 | #320 | Tragic 6.5% |
| Blacks/African Americans | 0.0 /100 | #321 | Tragic 6.5% |
| Vietnamese | 0.0 /100 | #322 | Tragic 6.5% |
| Immigrants | Belize | 0.0 /100 | #323 | Tragic 6.5% |
| Cheyenne | 0.0 /100 | #324 | Tragic 6.6% |
| Apache | 0.0 /100 | #325 | Tragic 6.6% |
| Natives/Alaskans | 0.0 /100 | #326 | Tragic 6.6% |
| Alaska Natives | 0.0 /100 | #327 | Tragic 6.6% |
| Guyanese | 0.0 /100 | #328 | Tragic 6.7% |
| Immigrants | Guyana | 0.0 /100 | #329 | Tragic 6.7% |
| Yakama | 0.0 /100 | #330 | Tragic 6.7% |
| Paiute | 0.0 /100 | #331 | Tragic 6.8% |
| Sioux | 0.0 /100 | #332 | Tragic 7.0% |