Choctaw vs Menominee Median Earnings
COMPARE
Choctaw
Menominee
Median Earnings
Median Earnings Comparison
Choctaw
Menominee
$40,270
MEDIAN EARNINGS
0.0/ 100
METRIC RATING
313th/ 347
METRIC RANK
$37,884
MEDIAN EARNINGS
0.0/ 100
METRIC RATING
339th/ 347
METRIC RANK
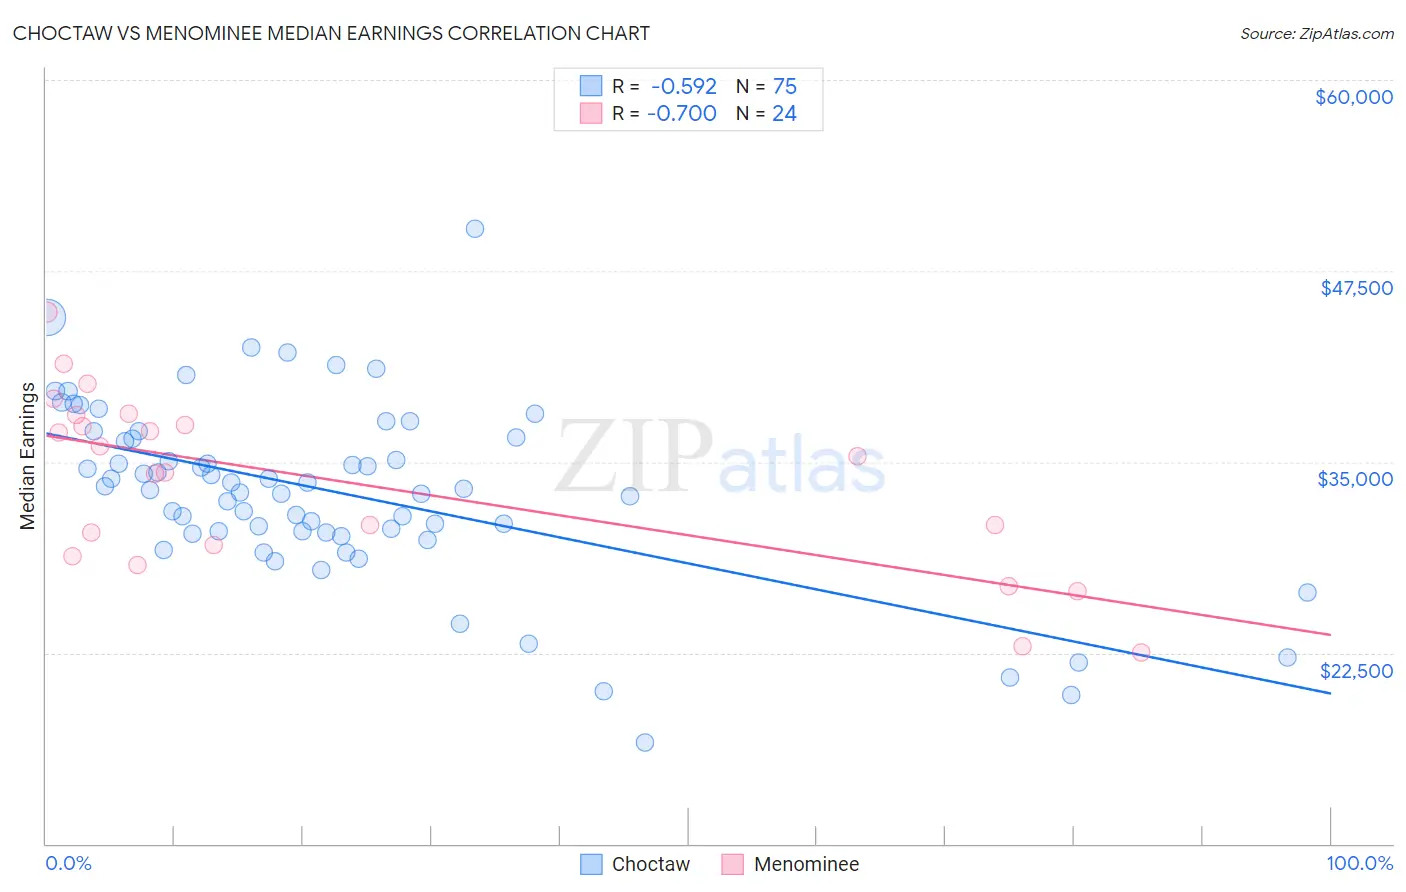
Choctaw vs Menominee Median Earnings Correlation Chart
The statistical analysis conducted on geographies consisting of 269,709,236 people shows a substantial negative correlation between the proportion of Choctaw and median earnings in the United States with a correlation coefficient (R) of -0.592 and weighted average of $40,270. Similarly, the statistical analysis conducted on geographies consisting of 45,778,612 people shows a strong negative correlation between the proportion of Menominee and median earnings in the United States with a correlation coefficient (R) of -0.700 and weighted average of $37,884, a difference of 6.3%.
Median Earnings Correlation Summary
| Measurement | Choctaw | Menominee |
| Minimum | $16,607 | $22,480 |
| Maximum | $50,240 | $44,793 |
| Range | $33,633 | $22,313 |
| Mean | $33,003 | $33,658 |
| Median | $33,256 | $34,813 |
| Interquartile 25% (IQ1) | $30,391 | $29,201 |
| Interquartile 75% (IQ3) | $36,563 | $37,722 |
| Interquartile Range (IQR) | $6,172 | $8,521 |
| Standard Deviation (Sample) | $5,920 | $5,845 |
| Standard Deviation (Population) | $5,880 | $5,722 |
Similar Demographics by Median Earnings
Demographics Similar to Choctaw by Median Earnings
In terms of median earnings, the demographic groups most similar to Choctaw are Hispanic or Latino ($40,288, a difference of 0.040%), Chippewa ($40,287, a difference of 0.040%), Cheyenne ($40,233, a difference of 0.090%), Seminole ($40,233, a difference of 0.090%), and Immigrants from Honduras ($40,195, a difference of 0.19%).
| Demographics | Rating | Rank | Median Earnings |
| Yaqui | 0.0 /100 | #306 | Tragic $40,647 |
| Hondurans | 0.0 /100 | #307 | Tragic $40,638 |
| Cubans | 0.0 /100 | #308 | Tragic $40,619 |
| Immigrants | Haiti | 0.0 /100 | #309 | Tragic $40,550 |
| Apache | 0.0 /100 | #310 | Tragic $40,388 |
| Hispanics or Latinos | 0.0 /100 | #311 | Tragic $40,288 |
| Chippewa | 0.0 /100 | #312 | Tragic $40,287 |
| Choctaw | 0.0 /100 | #313 | Tragic $40,270 |
| Cheyenne | 0.0 /100 | #314 | Tragic $40,233 |
| Seminole | 0.0 /100 | #315 | Tragic $40,233 |
| Immigrants | Honduras | 0.0 /100 | #316 | Tragic $40,195 |
| Fijians | 0.0 /100 | #317 | Tragic $40,193 |
| Dutch West Indians | 0.0 /100 | #318 | Tragic $40,107 |
| Blacks/African Americans | 0.0 /100 | #319 | Tragic $40,085 |
| Immigrants | Bahamas | 0.0 /100 | #320 | Tragic $39,861 |
Demographics Similar to Menominee by Median Earnings
In terms of median earnings, the demographic groups most similar to Menominee are Pima ($38,285, a difference of 1.1%), Immigrants from Cuba ($38,426, a difference of 1.4%), Crow ($38,707, a difference of 2.2%), Navajo ($36,999, a difference of 2.4%), and Native/Alaskan ($38,896, a difference of 2.7%).
| Demographics | Rating | Rank | Median Earnings |
| Yakama | 0.0 /100 | #332 | Tragic $39,107 |
| Houma | 0.0 /100 | #333 | Tragic $38,949 |
| Spanish American Indians | 0.0 /100 | #334 | Tragic $38,907 |
| Natives/Alaskans | 0.0 /100 | #335 | Tragic $38,896 |
| Crow | 0.0 /100 | #336 | Tragic $38,707 |
| Immigrants | Cuba | 0.0 /100 | #337 | Tragic $38,426 |
| Pima | 0.0 /100 | #338 | Tragic $38,285 |
| Menominee | 0.0 /100 | #339 | Tragic $37,884 |
| Navajo | 0.0 /100 | #340 | Tragic $36,999 |
| Lumbee | 0.0 /100 | #341 | Tragic $36,876 |
| Hopi | 0.0 /100 | #342 | Tragic $36,871 |
| Pueblo | 0.0 /100 | #343 | Tragic $36,859 |
| Arapaho | 0.0 /100 | #344 | Tragic $36,586 |
| Tohono O'odham | 0.0 /100 | #345 | Tragic $36,349 |
| Yup'ik | 0.0 /100 | #346 | Tragic $35,942 |