Chippewa vs Bangladeshi No Schooling Completed
COMPARE
Chippewa
Bangladeshi
No Schooling Completed
No Schooling Completed Comparison
Chippewa
Bangladeshis
1.6%
NO SCHOOLING COMPLETED
99.8/ 100
METRIC RATING
51st/ 347
METRIC RANK
3.5%
NO SCHOOLING COMPLETED
0.0/ 100
METRIC RATING
338th/ 347
METRIC RANK
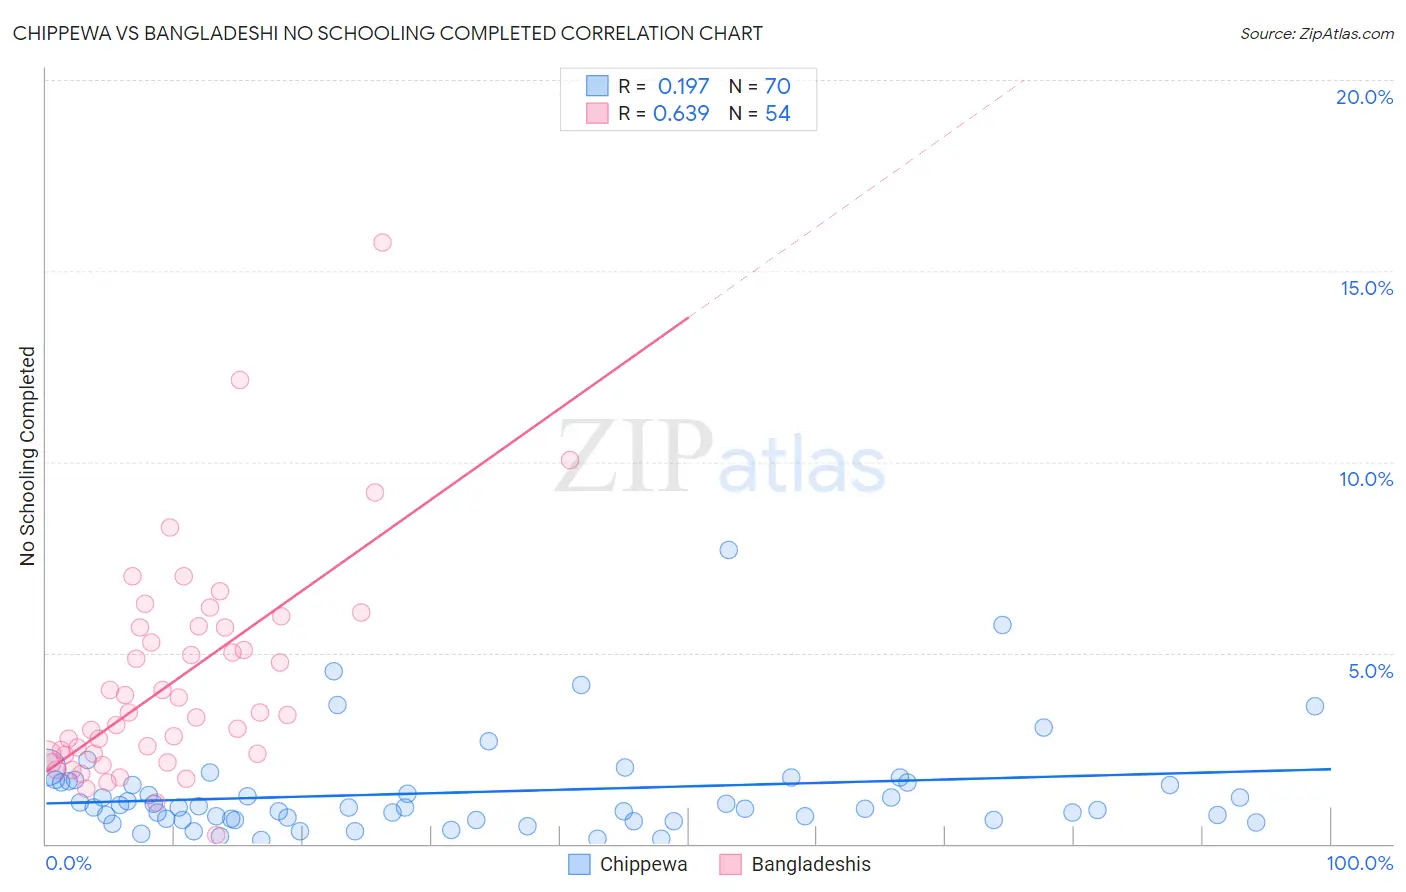
Chippewa vs Bangladeshi No Schooling Completed Correlation Chart
The statistical analysis conducted on geographies consisting of 212,932,058 people shows a poor positive correlation between the proportion of Chippewa and percentage of population with no schooling in the United States with a correlation coefficient (R) of 0.197 and weighted average of 1.6%. Similarly, the statistical analysis conducted on geographies consisting of 140,674,207 people shows a significant positive correlation between the proportion of Bangladeshis and percentage of population with no schooling in the United States with a correlation coefficient (R) of 0.639 and weighted average of 3.5%, a difference of 116.5%.
No Schooling Completed Correlation Summary
| Measurement | Chippewa | Bangladeshi |
| Minimum | 0.10% | 0.24% |
| Maximum | 7.7% | 15.7% |
| Range | 7.6% | 15.5% |
| Mean | 1.4% | 4.3% |
| Median | 0.96% | 3.4% |
| Interquartile 25% (IQ1) | 0.63% | 2.3% |
| Interquartile 75% (IQ3) | 1.6% | 5.7% |
| Interquartile Range (IQR) | 0.96% | 3.3% |
| Standard Deviation (Sample) | 1.3% | 2.9% |
| Standard Deviation (Population) | 1.3% | 2.8% |
Similar Demographics by No Schooling Completed
Demographics Similar to Chippewa by No Schooling Completed
In terms of no schooling completed, the demographic groups most similar to Chippewa are Immigrants from Canada (1.6%, a difference of 0.070%), Celtic (1.6%, a difference of 0.20%), Creek (1.6%, a difference of 0.20%), Crow (1.6%, a difference of 0.23%), and White/Caucasian (1.6%, a difference of 0.34%).
| Demographics | Rating | Rank | No Schooling Completed |
| Estonians | 99.9 /100 | #44 | Exceptional 1.6% |
| Czechoslovakians | 99.9 /100 | #45 | Exceptional 1.6% |
| Maltese | 99.9 /100 | #46 | Exceptional 1.6% |
| Ottawa | 99.9 /100 | #47 | Exceptional 1.6% |
| Immigrants | Scotland | 99.9 /100 | #48 | Exceptional 1.6% |
| Whites/Caucasians | 99.9 /100 | #49 | Exceptional 1.6% |
| Celtics | 99.9 /100 | #50 | Exceptional 1.6% |
| Chippewa | 99.8 /100 | #51 | Exceptional 1.6% |
| Immigrants | Canada | 99.8 /100 | #52 | Exceptional 1.6% |
| Creek | 99.8 /100 | #53 | Exceptional 1.6% |
| Crow | 99.8 /100 | #54 | Exceptional 1.6% |
| Greeks | 99.8 /100 | #55 | Exceptional 1.6% |
| Immigrants | North America | 99.8 /100 | #56 | Exceptional 1.6% |
| Austrians | 99.8 /100 | #57 | Exceptional 1.6% |
| Kiowa | 99.8 /100 | #58 | Exceptional 1.6% |
Demographics Similar to Bangladeshis by No Schooling Completed
In terms of no schooling completed, the demographic groups most similar to Bangladeshis are Immigrants from Cabo Verde (3.5%, a difference of 0.23%), Yakama (3.6%, a difference of 0.31%), Immigrants from Fiji (3.5%, a difference of 0.95%), Immigrants from Guatemala (3.6%, a difference of 1.0%), and Immigrants from Cambodia (3.5%, a difference of 1.3%).
| Demographics | Rating | Rank | No Schooling Completed |
| Japanese | 0.0 /100 | #331 | Tragic 3.3% |
| Central Americans | 0.0 /100 | #332 | Tragic 3.4% |
| Immigrants | Dominican Republic | 0.0 /100 | #333 | Tragic 3.4% |
| Guatemalans | 0.0 /100 | #334 | Tragic 3.5% |
| Immigrants | Cambodia | 0.0 /100 | #335 | Tragic 3.5% |
| Immigrants | Fiji | 0.0 /100 | #336 | Tragic 3.5% |
| Immigrants | Cabo Verde | 0.0 /100 | #337 | Tragic 3.5% |
| Bangladeshis | 0.0 /100 | #338 | Tragic 3.5% |
| Yakama | 0.0 /100 | #339 | Tragic 3.6% |
| Immigrants | Guatemala | 0.0 /100 | #340 | Tragic 3.6% |
| Immigrants | Central America | 0.0 /100 | #341 | Tragic 3.6% |
| Immigrants | Mexico | 0.0 /100 | #342 | Tragic 3.6% |
| Salvadorans | 0.0 /100 | #343 | Tragic 3.7% |
| Nepalese | 0.0 /100 | #344 | Tragic 3.8% |
| Immigrants | El Salvador | 0.0 /100 | #345 | Tragic 3.9% |