Nigerian vs Bangladeshi Median Female Earnings
COMPARE
Nigerian
Bangladeshi
Median Female Earnings
Median Female Earnings Comparison
Nigerians
Bangladeshis
$39,641
MEDIAN FEMALE EARNINGS
47.0/ 100
METRIC RATING
176th/ 347
METRIC RANK
$35,960
MEDIAN FEMALE EARNINGS
0.0/ 100
METRIC RATING
289th/ 347
METRIC RANK
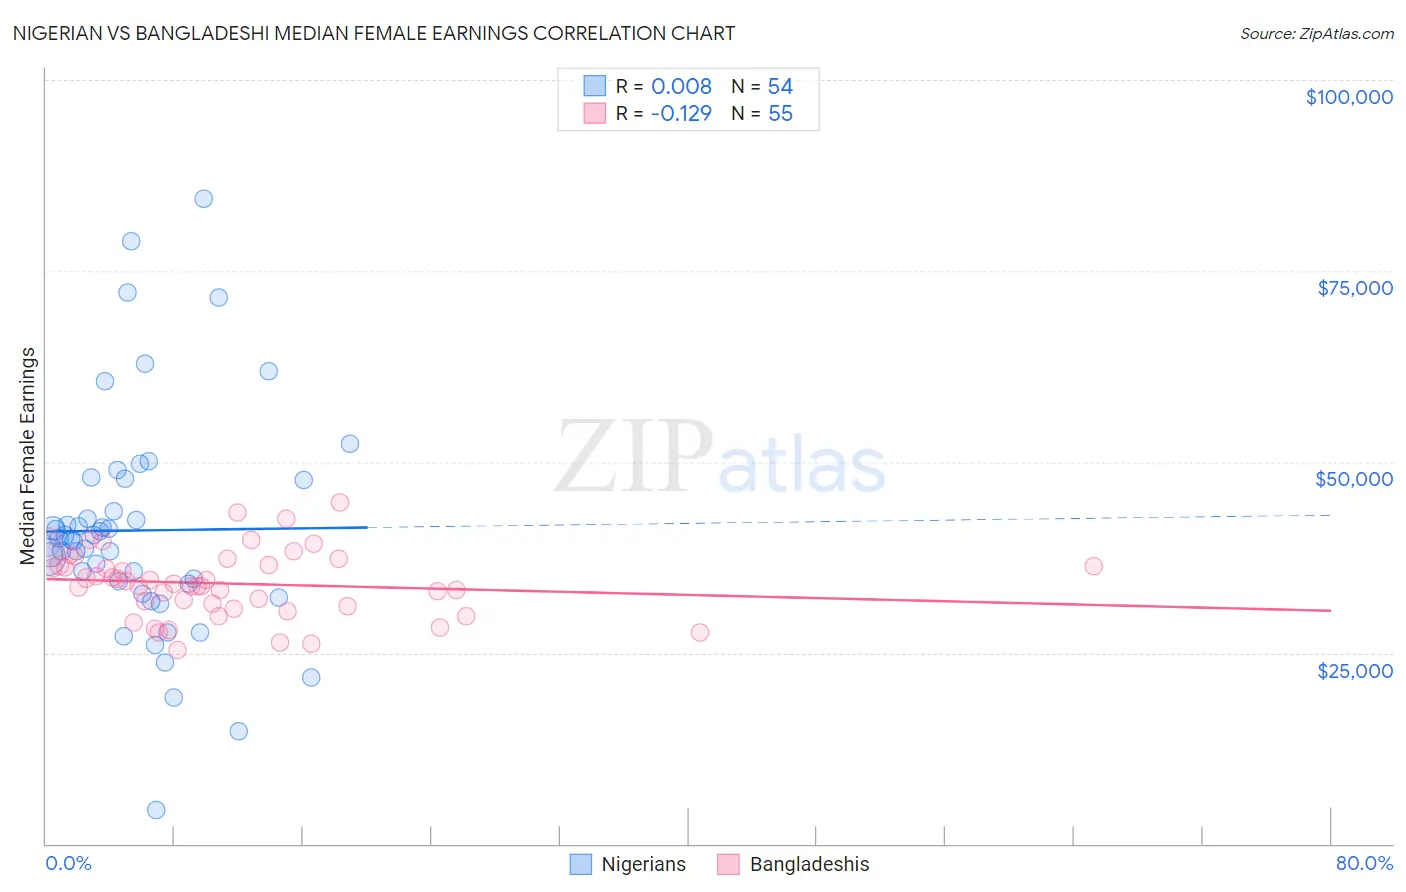
Nigerian vs Bangladeshi Median Female Earnings Correlation Chart
The statistical analysis conducted on geographies consisting of 332,727,329 people shows no correlation between the proportion of Nigerians and median female earnings in the United States with a correlation coefficient (R) of 0.008 and weighted average of $39,641. Similarly, the statistical analysis conducted on geographies consisting of 141,417,100 people shows a poor negative correlation between the proportion of Bangladeshis and median female earnings in the United States with a correlation coefficient (R) of -0.129 and weighted average of $35,960, a difference of 10.2%.
Median Female Earnings Correlation Summary
| Measurement | Nigerian | Bangladeshi |
| Minimum | $4,391 | $25,400 |
| Maximum | $84,500 | $44,719 |
| Range | $80,109 | $19,319 |
| Mean | $41,029 | $34,070 |
| Median | $39,924 | $34,114 |
| Interquartile 25% (IQ1) | $33,961 | $31,090 |
| Interquartile 75% (IQ3) | $47,567 | $36,435 |
| Interquartile Range (IQR) | $13,606 | $5,345 |
| Standard Deviation (Sample) | $14,779 | $4,364 |
| Standard Deviation (Population) | $14,642 | $4,325 |
Similar Demographics by Median Female Earnings
Demographics Similar to Nigerians by Median Female Earnings
In terms of median female earnings, the demographic groups most similar to Nigerians are Immigrants from South America ($39,643, a difference of 0.010%), Costa Rican ($39,622, a difference of 0.050%), Slavic ($39,613, a difference of 0.070%), Immigrants from Germany ($39,603, a difference of 0.10%), and South American ($39,698, a difference of 0.14%).
| Demographics | Rating | Rank | Median Female Earnings |
| Kenyans | 58.4 /100 | #169 | Average $39,860 |
| Slovenes | 56.2 /100 | #170 | Average $39,817 |
| Immigrants | Portugal | 54.7 /100 | #171 | Average $39,788 |
| British | 53.8 /100 | #172 | Average $39,772 |
| Canadians | 51.4 /100 | #173 | Average $39,724 |
| South Americans | 50.0 /100 | #174 | Average $39,698 |
| Immigrants | South America | 47.2 /100 | #175 | Average $39,643 |
| Nigerians | 47.0 /100 | #176 | Average $39,641 |
| Costa Ricans | 46.1 /100 | #177 | Average $39,622 |
| Slavs | 45.6 /100 | #178 | Average $39,613 |
| Immigrants | Germany | 45.1 /100 | #179 | Average $39,603 |
| Immigrants | Kenya | 41.6 /100 | #180 | Average $39,535 |
| Tsimshian | 41.4 /100 | #181 | Average $39,530 |
| Tlingit-Haida | 40.5 /100 | #182 | Average $39,513 |
| Hungarians | 40.3 /100 | #183 | Average $39,510 |
Demographics Similar to Bangladeshis by Median Female Earnings
In terms of median female earnings, the demographic groups most similar to Bangladeshis are Central American Indian ($35,930, a difference of 0.080%), Immigrants from Zaire ($36,017, a difference of 0.16%), Immigrants from Nicaragua ($36,023, a difference of 0.17%), Osage ($36,034, a difference of 0.21%), and Paiute ($36,056, a difference of 0.27%).
| Demographics | Rating | Rank | Median Female Earnings |
| Haitians | 0.1 /100 | #282 | Tragic $36,374 |
| Immigrants | Haiti | 0.1 /100 | #283 | Tragic $36,203 |
| Indonesians | 0.1 /100 | #284 | Tragic $36,140 |
| Paiute | 0.1 /100 | #285 | Tragic $36,056 |
| Osage | 0.0 /100 | #286 | Tragic $36,034 |
| Immigrants | Nicaragua | 0.0 /100 | #287 | Tragic $36,023 |
| Immigrants | Zaire | 0.0 /100 | #288 | Tragic $36,017 |
| Bangladeshis | 0.0 /100 | #289 | Tragic $35,960 |
| Central American Indians | 0.0 /100 | #290 | Tragic $35,930 |
| Blackfeet | 0.0 /100 | #291 | Tragic $35,864 |
| Americans | 0.0 /100 | #292 | Tragic $35,777 |
| Guatemalans | 0.0 /100 | #293 | Tragic $35,695 |
| Cheyenne | 0.0 /100 | #294 | Tragic $35,673 |
| Comanche | 0.0 /100 | #295 | Tragic $35,661 |
| Mexican American Indians | 0.0 /100 | #296 | Tragic $35,629 |