Inupiat vs Bangladeshi Median Female Earnings
COMPARE
Inupiat
Bangladeshi
Median Female Earnings
Median Female Earnings Comparison
Inupiat
Bangladeshis
$40,080
MEDIAN FEMALE EARNINGS
68.9/ 100
METRIC RATING
160th/ 347
METRIC RANK
$35,960
MEDIAN FEMALE EARNINGS
0.0/ 100
METRIC RATING
289th/ 347
METRIC RANK
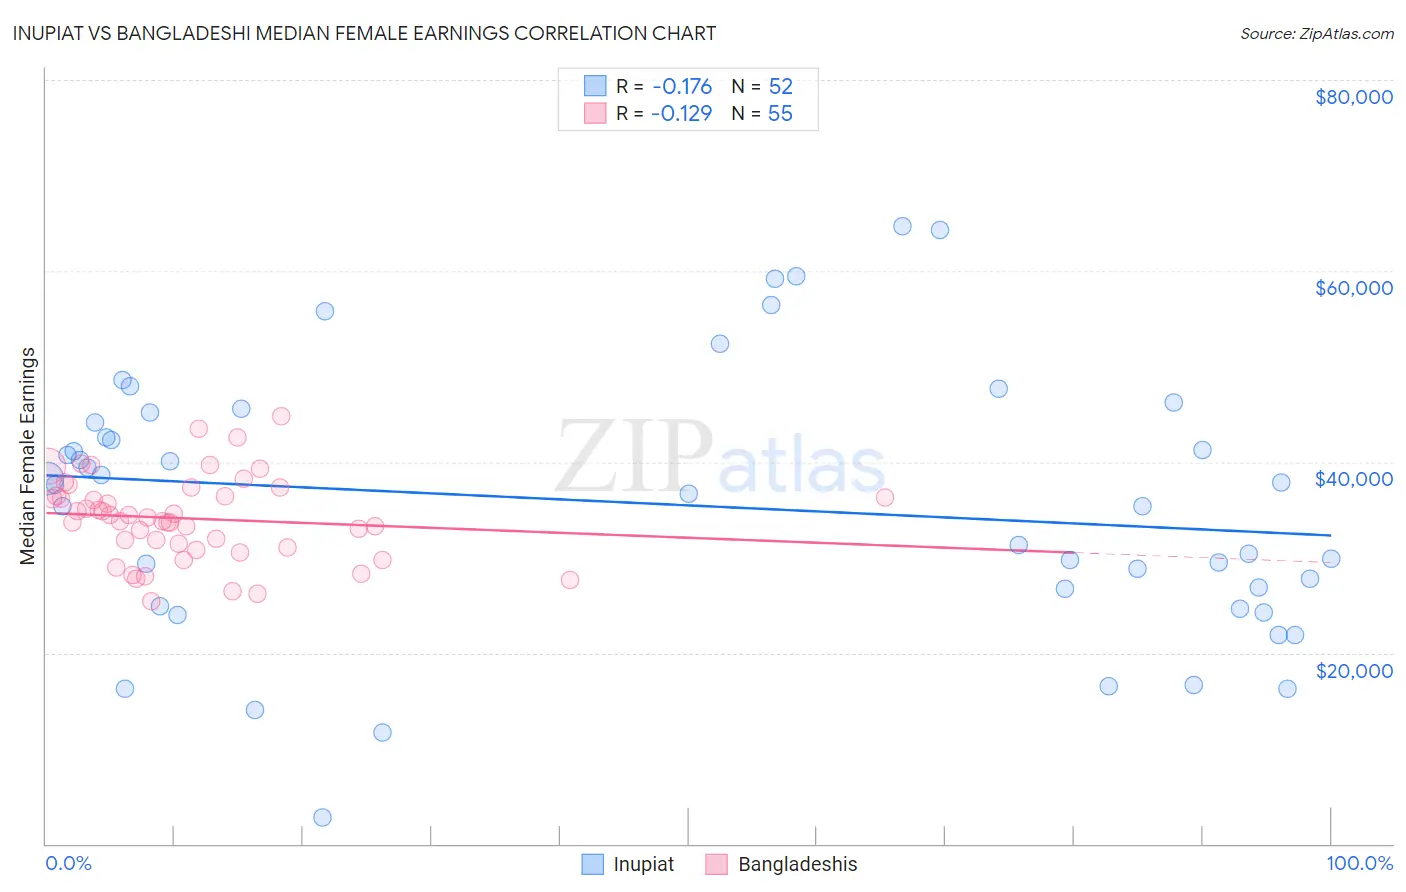
Inupiat vs Bangladeshi Median Female Earnings Correlation Chart
The statistical analysis conducted on geographies consisting of 96,311,190 people shows a poor negative correlation between the proportion of Inupiat and median female earnings in the United States with a correlation coefficient (R) of -0.176 and weighted average of $40,080. Similarly, the statistical analysis conducted on geographies consisting of 141,417,100 people shows a poor negative correlation between the proportion of Bangladeshis and median female earnings in the United States with a correlation coefficient (R) of -0.129 and weighted average of $35,960, a difference of 11.5%.
Median Female Earnings Correlation Summary
| Measurement | Inupiat | Bangladeshi |
| Minimum | $2,800 | $25,400 |
| Maximum | $64,688 | $44,719 |
| Range | $61,888 | $19,319 |
| Mean | $35,589 | $34,070 |
| Median | $37,155 | $34,114 |
| Interquartile 25% (IQ1) | $25,800 | $31,090 |
| Interquartile 75% (IQ3) | $44,695 | $36,435 |
| Interquartile Range (IQR) | $18,895 | $5,345 |
| Standard Deviation (Sample) | $13,962 | $4,364 |
| Standard Deviation (Population) | $13,827 | $4,325 |
Similar Demographics by Median Female Earnings
Demographics Similar to Inupiat by Median Female Earnings
In terms of median female earnings, the demographic groups most similar to Inupiat are Alsatian ($40,060, a difference of 0.050%), South American Indian ($40,019, a difference of 0.15%), Immigrants from Vietnam ($40,153, a difference of 0.18%), Lebanese ($40,006, a difference of 0.18%), and Immigrants from Senegal ($40,157, a difference of 0.19%).
| Demographics | Rating | Rank | Median Female Earnings |
| British West Indians | 77.7 /100 | #153 | Good $40,299 |
| Immigrants | Oceania | 77.6 /100 | #154 | Good $40,297 |
| Immigrants | Africa | 76.2 /100 | #155 | Good $40,257 |
| Peruvians | 75.3 /100 | #156 | Good $40,234 |
| Portuguese | 73.0 /100 | #157 | Good $40,177 |
| Immigrants | Senegal | 72.2 /100 | #158 | Good $40,157 |
| Immigrants | Vietnam | 72.0 /100 | #159 | Good $40,153 |
| Inupiat | 68.9 /100 | #160 | Good $40,080 |
| Alsatians | 68.0 /100 | #161 | Good $40,060 |
| South American Indians | 66.1 /100 | #162 | Good $40,019 |
| Lebanese | 65.5 /100 | #163 | Good $40,006 |
| Immigrants | Saudi Arabia | 62.9 /100 | #164 | Good $39,952 |
| Immigrants | Bangladesh | 60.8 /100 | #165 | Good $39,910 |
| Immigrants | Ghana | 60.0 /100 | #166 | Good $39,894 |
| Luxembourgers | 59.9 /100 | #167 | Average $39,891 |
Demographics Similar to Bangladeshis by Median Female Earnings
In terms of median female earnings, the demographic groups most similar to Bangladeshis are Central American Indian ($35,930, a difference of 0.080%), Immigrants from Zaire ($36,017, a difference of 0.16%), Immigrants from Nicaragua ($36,023, a difference of 0.17%), Osage ($36,034, a difference of 0.21%), and Paiute ($36,056, a difference of 0.27%).
| Demographics | Rating | Rank | Median Female Earnings |
| Haitians | 0.1 /100 | #282 | Tragic $36,374 |
| Immigrants | Haiti | 0.1 /100 | #283 | Tragic $36,203 |
| Indonesians | 0.1 /100 | #284 | Tragic $36,140 |
| Paiute | 0.1 /100 | #285 | Tragic $36,056 |
| Osage | 0.0 /100 | #286 | Tragic $36,034 |
| Immigrants | Nicaragua | 0.0 /100 | #287 | Tragic $36,023 |
| Immigrants | Zaire | 0.0 /100 | #288 | Tragic $36,017 |
| Bangladeshis | 0.0 /100 | #289 | Tragic $35,960 |
| Central American Indians | 0.0 /100 | #290 | Tragic $35,930 |
| Blackfeet | 0.0 /100 | #291 | Tragic $35,864 |
| Americans | 0.0 /100 | #292 | Tragic $35,777 |
| Guatemalans | 0.0 /100 | #293 | Tragic $35,695 |
| Cheyenne | 0.0 /100 | #294 | Tragic $35,673 |
| Comanche | 0.0 /100 | #295 | Tragic $35,661 |
| Mexican American Indians | 0.0 /100 | #296 | Tragic $35,629 |