Immigrants from South Africa vs Argentinean Median Female Earnings
COMPARE
Immigrants from South Africa
Argentinean
Median Female Earnings
Median Female Earnings Comparison
Immigrants from South Africa
Argentineans
$42,508
MEDIAN FEMALE EARNINGS
99.7/ 100
METRIC RATING
74th/ 347
METRIC RANK
$41,952
MEDIAN FEMALE EARNINGS
99.1/ 100
METRIC RATING
92nd/ 347
METRIC RANK
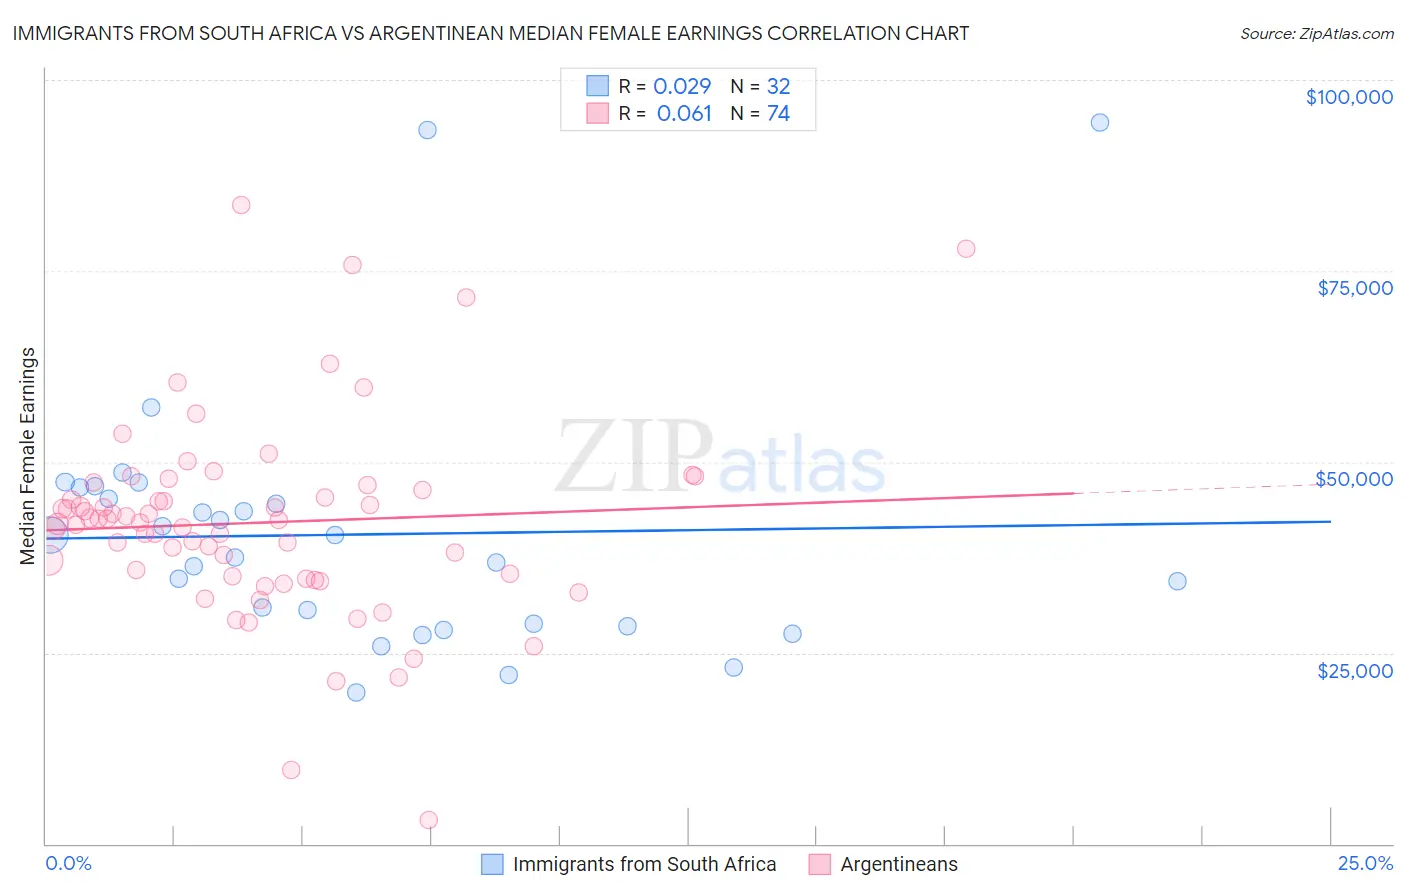
Immigrants from South Africa vs Argentinean Median Female Earnings Correlation Chart
The statistical analysis conducted on geographies consisting of 233,273,838 people shows no correlation between the proportion of Immigrants from South Africa and median female earnings in the United States with a correlation coefficient (R) of 0.029 and weighted average of $42,508. Similarly, the statistical analysis conducted on geographies consisting of 297,092,103 people shows a slight positive correlation between the proportion of Argentineans and median female earnings in the United States with a correlation coefficient (R) of 0.061 and weighted average of $41,952, a difference of 1.3%.
Median Female Earnings Correlation Summary
| Measurement | Immigrants from South Africa | Argentinean |
| Minimum | $19,821 | $3,125 |
| Maximum | $94,510 | $83,609 |
| Range | $74,689 | $80,484 |
| Mean | $40,489 | $42,021 |
| Median | $38,975 | $42,177 |
| Interquartile 25% (IQ1) | $28,607 | $34,978 |
| Interquartile 75% (IQ3) | $45,877 | $46,250 |
| Interquartile Range (IQR) | $17,270 | $11,272 |
| Standard Deviation (Sample) | $16,714 | $13,019 |
| Standard Deviation (Population) | $16,451 | $12,930 |
Demographics Similar to Immigrants from South Africa and Argentineans by Median Female Earnings
In terms of median female earnings, the demographic groups most similar to Immigrants from South Africa are Mongolian ($42,542, a difference of 0.080%), New Zealander ($42,446, a difference of 0.15%), Immigrants from Italy ($42,446, a difference of 0.15%), Immigrants from Albania ($42,388, a difference of 0.28%), and Immigrants from Kazakhstan ($42,386, a difference of 0.29%). Similarly, the demographic groups most similar to Argentineans are Immigrants from Grenada ($41,932, a difference of 0.050%), Immigrants from Western Europe ($41,990, a difference of 0.090%), Ukrainian ($42,015, a difference of 0.15%), Immigrants from Afghanistan ($42,055, a difference of 0.25%), and Immigrants from Northern Africa ($42,084, a difference of 0.31%).
| Demographics | Rating | Rank | Median Female Earnings |
| Mongolians | 99.7 /100 | #73 | Exceptional $42,542 |
| Immigrants | South Africa | 99.7 /100 | #74 | Exceptional $42,508 |
| New Zealanders | 99.7 /100 | #75 | Exceptional $42,446 |
| Immigrants | Italy | 99.7 /100 | #76 | Exceptional $42,446 |
| Immigrants | Albania | 99.6 /100 | #77 | Exceptional $42,388 |
| Immigrants | Kazakhstan | 99.6 /100 | #78 | Exceptional $42,386 |
| Greeks | 99.6 /100 | #79 | Exceptional $42,336 |
| Immigrants | Moldova | 99.6 /100 | #80 | Exceptional $42,304 |
| Immigrants | Southern Europe | 99.5 /100 | #81 | Exceptional $42,275 |
| Immigrants | Morocco | 99.5 /100 | #82 | Exceptional $42,229 |
| Immigrants | Sierra Leone | 99.5 /100 | #83 | Exceptional $42,214 |
| Armenians | 99.5 /100 | #84 | Exceptional $42,212 |
| Laotians | 99.4 /100 | #85 | Exceptional $42,133 |
| Immigrants | St. Vincent and the Grenadines | 99.3 /100 | #86 | Exceptional $42,108 |
| Lithuanians | 99.3 /100 | #87 | Exceptional $42,108 |
| Immigrants | Northern Africa | 99.3 /100 | #88 | Exceptional $42,084 |
| Immigrants | Afghanistan | 99.3 /100 | #89 | Exceptional $42,055 |
| Ukrainians | 99.2 /100 | #90 | Exceptional $42,015 |
| Immigrants | Western Europe | 99.2 /100 | #91 | Exceptional $41,990 |
| Argentineans | 99.1 /100 | #92 | Exceptional $41,952 |
| Immigrants | Grenada | 99.0 /100 | #93 | Exceptional $41,932 |