Chippewa vs Argentinean GED/Equivalency
COMPARE
Chippewa
Argentinean
GED/Equivalency
GED/Equivalency Comparison
Chippewa
Argentineans
85.2%
GED/EQUIVALENCY
20.8/ 100
METRIC RATING
195th/ 347
METRIC RANK
86.7%
GED/EQUIVALENCY
89.7/ 100
METRIC RATING
127th/ 347
METRIC RANK
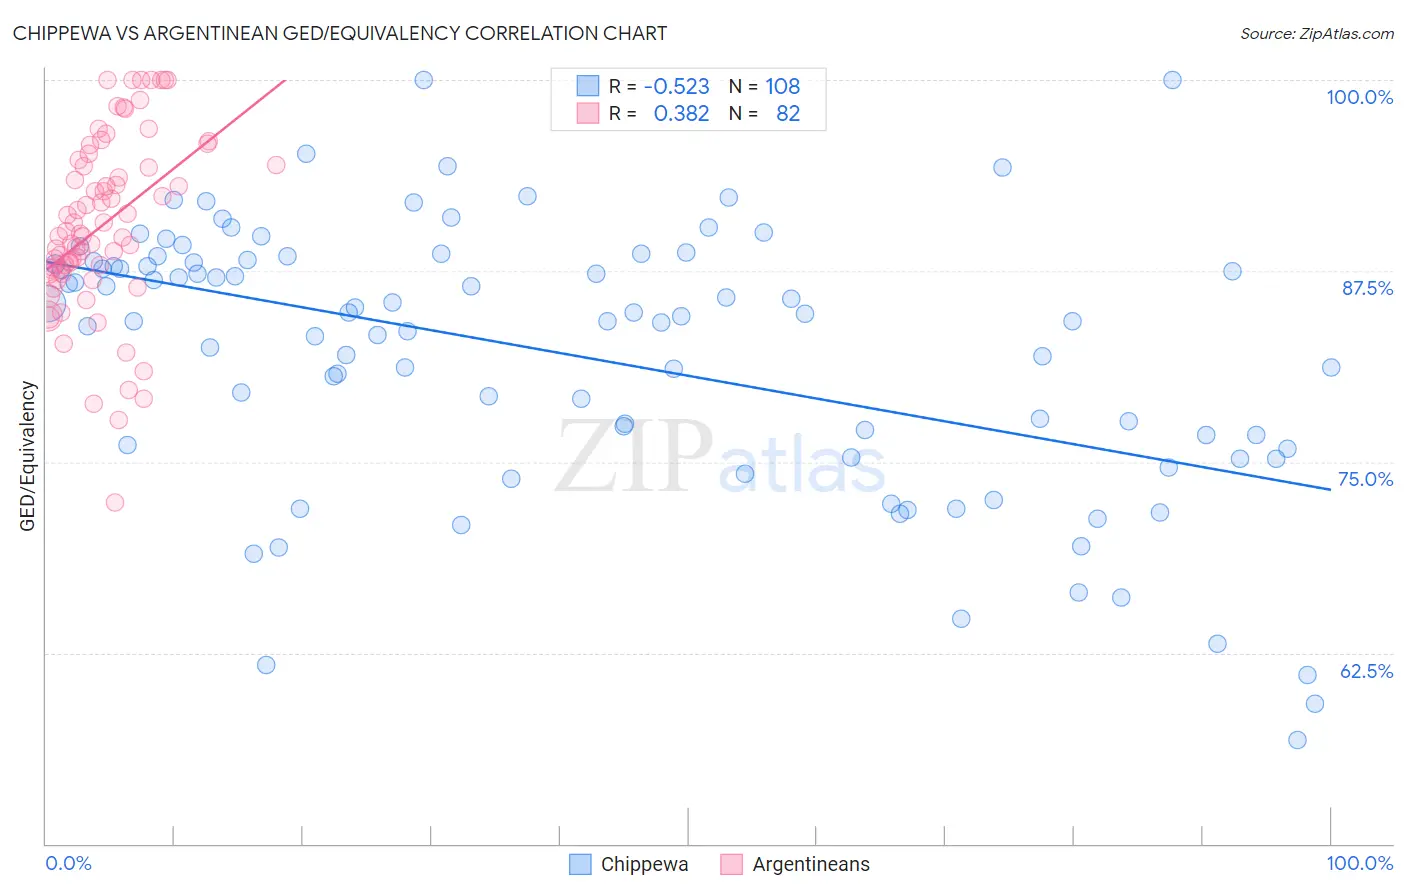
Chippewa vs Argentinean GED/Equivalency Correlation Chart
The statistical analysis conducted on geographies consisting of 215,068,282 people shows a substantial negative correlation between the proportion of Chippewa and percentage of population with at least ged/equivalency education in the United States with a correlation coefficient (R) of -0.523 and weighted average of 85.2%. Similarly, the statistical analysis conducted on geographies consisting of 297,143,432 people shows a mild positive correlation between the proportion of Argentineans and percentage of population with at least ged/equivalency education in the United States with a correlation coefficient (R) of 0.382 and weighted average of 86.7%, a difference of 1.8%.
GED/Equivalency Correlation Summary
| Measurement | Chippewa | Argentinean |
| Minimum | 56.8% | 72.4% |
| Maximum | 100.0% | 100.0% |
| Range | 43.2% | 27.6% |
| Mean | 82.0% | 90.5% |
| Median | 84.4% | 89.9% |
| Interquartile 25% (IQ1) | 76.0% | 87.5% |
| Interquartile 75% (IQ3) | 88.1% | 94.5% |
| Interquartile Range (IQR) | 12.1% | 7.0% |
| Standard Deviation (Sample) | 8.8% | 5.8% |
| Standard Deviation (Population) | 8.8% | 5.7% |
Similar Demographics by GED/Equivalency
Demographics Similar to Chippewa by GED/Equivalency
In terms of ged/equivalency, the demographic groups most similar to Chippewa are Puget Sound Salish (85.2%, a difference of 0.0%), Tongan (85.2%, a difference of 0.0%), Costa Rican (85.2%, a difference of 0.010%), Delaware (85.2%, a difference of 0.040%), and South American Indian (85.2%, a difference of 0.060%).
| Demographics | Rating | Rank | GED/Equivalency |
| Immigrants | Sierra Leone | 29.0 /100 | #188 | Fair 85.4% |
| Guamanians/Chamorros | 28.4 /100 | #189 | Fair 85.3% |
| Alaskan Athabascans | 27.5 /100 | #190 | Fair 85.3% |
| South American Indians | 22.8 /100 | #191 | Fair 85.2% |
| Immigrants | Nonimmigrants | 22.7 /100 | #192 | Fair 85.2% |
| Delaware | 22.2 /100 | #193 | Fair 85.2% |
| Puget Sound Salish | 20.8 /100 | #194 | Fair 85.2% |
| Chippewa | 20.8 /100 | #195 | Fair 85.2% |
| Tongans | 20.7 /100 | #196 | Fair 85.2% |
| Costa Ricans | 20.4 /100 | #197 | Fair 85.2% |
| Immigrants | Africa | 17.5 /100 | #198 | Poor 85.1% |
| Somalis | 16.4 /100 | #199 | Poor 85.0% |
| Uruguayans | 16.0 /100 | #200 | Poor 85.0% |
| Portuguese | 15.9 /100 | #201 | Poor 85.0% |
| Cree | 15.9 /100 | #202 | Poor 85.0% |
Demographics Similar to Argentineans by GED/Equivalency
In terms of ged/equivalency, the demographic groups most similar to Argentineans are Yugoslavian (86.7%, a difference of 0.010%), Asian (86.7%, a difference of 0.030%), Immigrants from Egypt (86.7%, a difference of 0.040%), Celtic (86.7%, a difference of 0.040%), and Immigrants from Ukraine (86.7%, a difference of 0.040%).
| Demographics | Rating | Rank | GED/Equivalency |
| Scotch-Irish | 91.6 /100 | #120 | Exceptional 86.8% |
| Immigrants | Lebanon | 90.9 /100 | #121 | Exceptional 86.8% |
| Immigrants | Jordan | 90.8 /100 | #122 | Exceptional 86.8% |
| Immigrants | Italy | 90.5 /100 | #123 | Exceptional 86.7% |
| Immigrants | Egypt | 90.4 /100 | #124 | Exceptional 86.7% |
| Celtics | 90.4 /100 | #125 | Exceptional 86.7% |
| Asians | 90.3 /100 | #126 | Exceptional 86.7% |
| Argentineans | 89.7 /100 | #127 | Excellent 86.7% |
| Yugoslavians | 89.5 /100 | #128 | Excellent 86.7% |
| Immigrants | Ukraine | 88.9 /100 | #129 | Excellent 86.7% |
| Immigrants | Germany | 88.8 /100 | #130 | Excellent 86.7% |
| Immigrants | Spain | 88.5 /100 | #131 | Excellent 86.7% |
| Immigrants | Brazil | 88.4 /100 | #132 | Excellent 86.6% |
| Tsimshian | 88.3 /100 | #133 | Excellent 86.6% |
| Albanians | 87.7 /100 | #134 | Excellent 86.6% |