Immigrants from Scotland vs Argentinean Median Female Earnings
COMPARE
Immigrants from Scotland
Argentinean
Median Female Earnings
Median Female Earnings Comparison
Immigrants from Scotland
Argentineans
$41,771
MEDIAN FEMALE EARNINGS
98.7/ 100
METRIC RATING
98th/ 347
METRIC RANK
$41,952
MEDIAN FEMALE EARNINGS
99.1/ 100
METRIC RATING
92nd/ 347
METRIC RANK
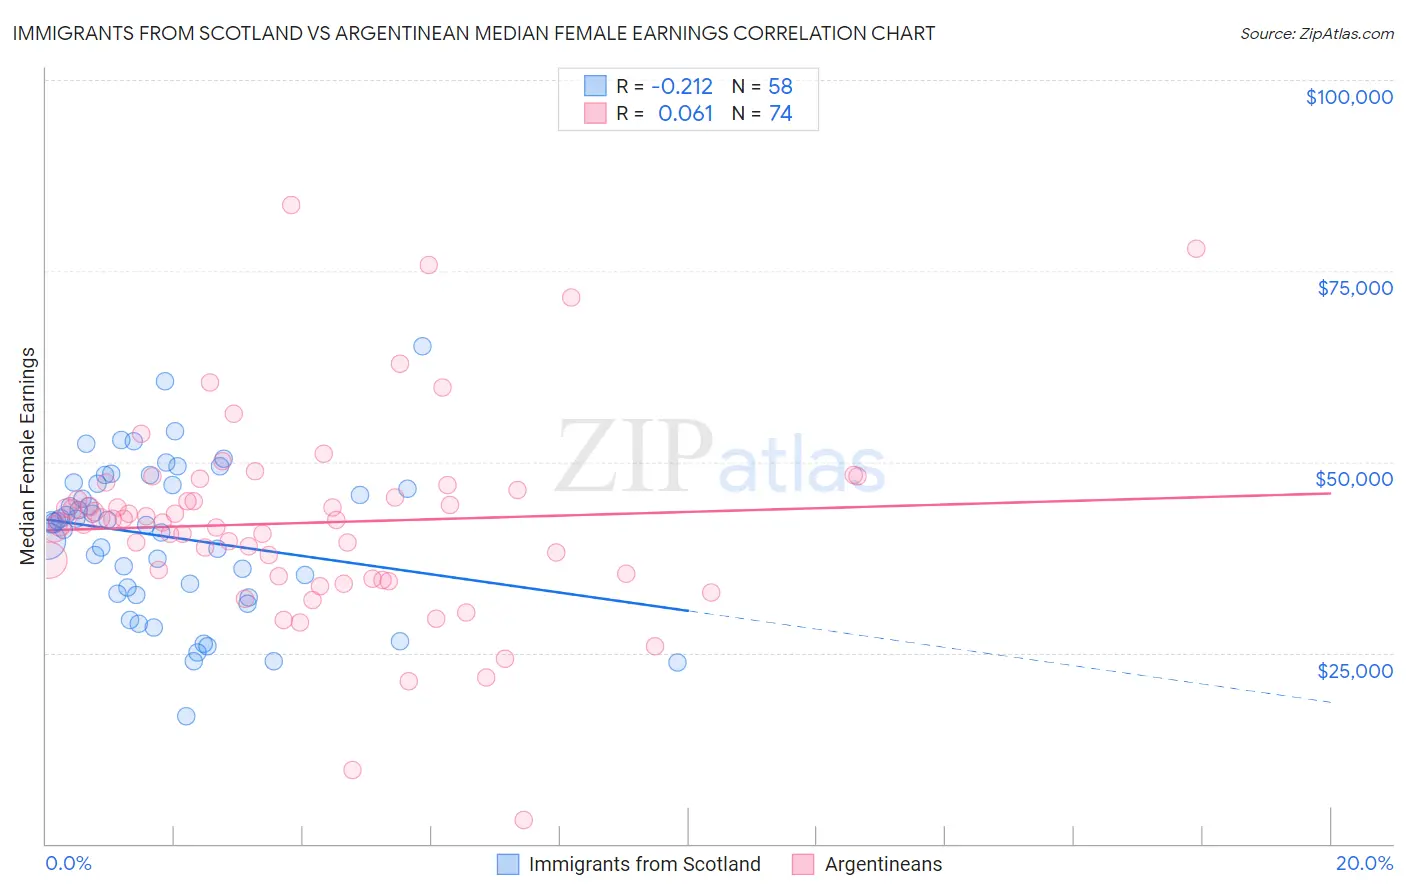
Immigrants from Scotland vs Argentinean Median Female Earnings Correlation Chart
The statistical analysis conducted on geographies consisting of 196,348,950 people shows a weak negative correlation between the proportion of Immigrants from Scotland and median female earnings in the United States with a correlation coefficient (R) of -0.212 and weighted average of $41,771. Similarly, the statistical analysis conducted on geographies consisting of 297,092,103 people shows a slight positive correlation between the proportion of Argentineans and median female earnings in the United States with a correlation coefficient (R) of 0.061 and weighted average of $41,952, a difference of 0.43%.
Median Female Earnings Correlation Summary
| Measurement | Immigrants from Scotland | Argentinean |
| Minimum | $16,733 | $3,125 |
| Maximum | $65,203 | $83,609 |
| Range | $48,470 | $80,484 |
| Mean | $40,188 | $42,021 |
| Median | $42,027 | $42,177 |
| Interquartile 25% (IQ1) | $32,757 | $34,978 |
| Interquartile 75% (IQ3) | $47,181 | $46,250 |
| Interquartile Range (IQR) | $14,424 | $11,272 |
| Standard Deviation (Sample) | $9,888 | $13,019 |
| Standard Deviation (Population) | $9,803 | $12,930 |
Demographics Similar to Immigrants from Scotland and Argentineans by Median Female Earnings
In terms of median female earnings, the demographic groups most similar to Immigrants from Scotland are Immigrants from Hungary ($41,820, a difference of 0.12%), South African ($41,825, a difference of 0.13%), Immigrants from Barbados ($41,685, a difference of 0.21%), Moroccan ($41,872, a difference of 0.24%), and Immigrants from Netherlands ($41,870, a difference of 0.24%). Similarly, the demographic groups most similar to Argentineans are Immigrants from Grenada ($41,932, a difference of 0.050%), Immigrants from Western Europe ($41,990, a difference of 0.090%), Ukrainian ($42,015, a difference of 0.15%), Moroccan ($41,872, a difference of 0.19%), and Immigrants from Netherlands ($41,870, a difference of 0.20%).
| Demographics | Rating | Rank | Median Female Earnings |
| Laotians | 99.4 /100 | #85 | Exceptional $42,133 |
| Immigrants | St. Vincent and the Grenadines | 99.3 /100 | #86 | Exceptional $42,108 |
| Lithuanians | 99.3 /100 | #87 | Exceptional $42,108 |
| Immigrants | Northern Africa | 99.3 /100 | #88 | Exceptional $42,084 |
| Immigrants | Afghanistan | 99.3 /100 | #89 | Exceptional $42,055 |
| Ukrainians | 99.2 /100 | #90 | Exceptional $42,015 |
| Immigrants | Western Europe | 99.2 /100 | #91 | Exceptional $41,990 |
| Argentineans | 99.1 /100 | #92 | Exceptional $41,952 |
| Immigrants | Grenada | 99.0 /100 | #93 | Exceptional $41,932 |
| Moroccans | 98.9 /100 | #94 | Exceptional $41,872 |
| Immigrants | Netherlands | 98.9 /100 | #95 | Exceptional $41,870 |
| South Africans | 98.8 /100 | #96 | Exceptional $41,825 |
| Immigrants | Hungary | 98.8 /100 | #97 | Exceptional $41,820 |
| Immigrants | Scotland | 98.7 /100 | #98 | Exceptional $41,771 |
| Immigrants | Barbados | 98.4 /100 | #99 | Exceptional $41,685 |
| Romanians | 98.3 /100 | #100 | Exceptional $41,663 |
| Immigrants | Fiji | 98.3 /100 | #101 | Exceptional $41,656 |
| Immigrants | Poland | 98.2 /100 | #102 | Exceptional $41,630 |
| Immigrants | Argentina | 97.9 /100 | #103 | Exceptional $41,554 |
| Immigrants | Zimbabwe | 97.8 /100 | #104 | Exceptional $41,527 |
| Italians | 97.7 /100 | #105 | Exceptional $41,505 |