Cherokee vs Central American Median Earnings
COMPARE
Cherokee
Central American
Median Earnings
Median Earnings Comparison
Cherokee
Central Americans
$41,252
MEDIAN EARNINGS
0.1/ 100
METRIC RATING
296th/ 347
METRIC RANK
$42,280
MEDIAN EARNINGS
0.3/ 100
METRIC RATING
277th/ 347
METRIC RANK
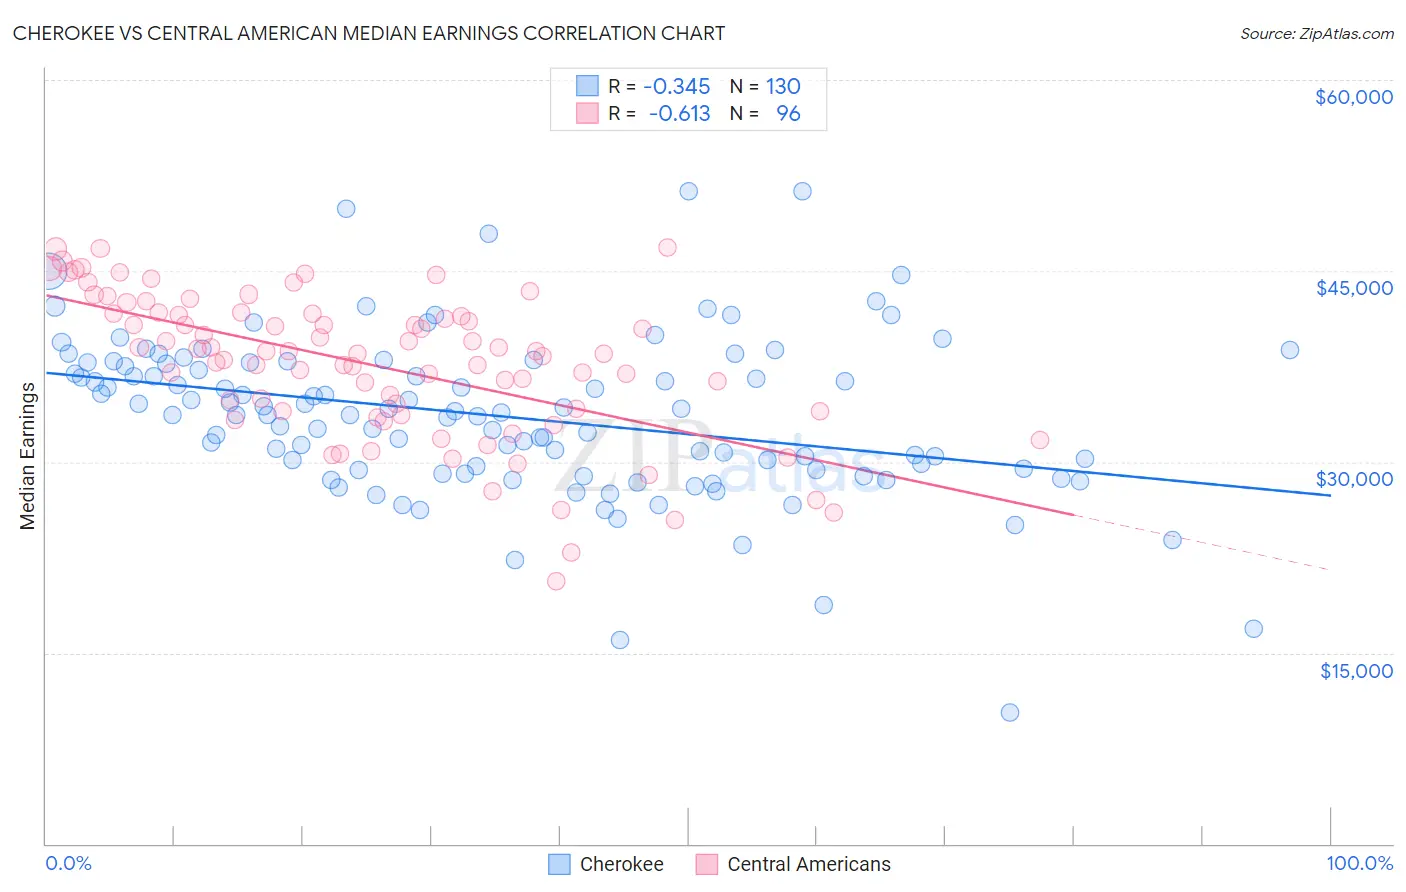
Cherokee vs Central American Median Earnings Correlation Chart
The statistical analysis conducted on geographies consisting of 493,557,174 people shows a mild negative correlation between the proportion of Cherokee and median earnings in the United States with a correlation coefficient (R) of -0.345 and weighted average of $41,252. Similarly, the statistical analysis conducted on geographies consisting of 504,567,370 people shows a significant negative correlation between the proportion of Central Americans and median earnings in the United States with a correlation coefficient (R) of -0.613 and weighted average of $42,280, a difference of 2.5%.
Median Earnings Correlation Summary
| Measurement | Cherokee | Central American |
| Minimum | $10,267 | $20,583 |
| Maximum | $51,250 | $46,875 |
| Range | $40,983 | $26,292 |
| Mean | $33,603 | $37,665 |
| Median | $33,784 | $38,592 |
| Interquartile 25% (IQ1) | $29,375 | $34,004 |
| Interquartile 75% (IQ3) | $37,767 | $41,685 |
| Interquartile Range (IQR) | $8,392 | $7,681 |
| Standard Deviation (Sample) | $6,429 | $5,685 |
| Standard Deviation (Population) | $6,404 | $5,655 |
Demographics Similar to Cherokee and Central Americans by Median Earnings
In terms of median earnings, the demographic groups most similar to Cherokee are Bangladeshi ($41,263, a difference of 0.030%), Potawatomi ($41,288, a difference of 0.090%), Immigrants from Zaire ($41,325, a difference of 0.18%), U.S. Virgin Islander ($41,448, a difference of 0.47%), and Central American Indian ($41,474, a difference of 0.54%). Similarly, the demographic groups most similar to Central Americans are Spanish American ($42,316, a difference of 0.090%), Cajun ($42,189, a difference of 0.21%), Colville ($42,151, a difference of 0.31%), Hmong ($42,111, a difference of 0.40%), and Marshallese ($41,969, a difference of 0.74%).
| Demographics | Rating | Rank | Median Earnings |
| Spanish Americans | 0.3 /100 | #276 | Tragic $42,316 |
| Central Americans | 0.3 /100 | #277 | Tragic $42,280 |
| Cajuns | 0.3 /100 | #278 | Tragic $42,189 |
| Colville | 0.2 /100 | #279 | Tragic $42,151 |
| Hmong | 0.2 /100 | #280 | Tragic $42,111 |
| Marshallese | 0.2 /100 | #281 | Tragic $41,969 |
| Africans | 0.2 /100 | #282 | Tragic $41,955 |
| Dominicans | 0.2 /100 | #283 | Tragic $41,864 |
| Blackfeet | 0.2 /100 | #284 | Tragic $41,822 |
| Immigrants | Nicaragua | 0.1 /100 | #285 | Tragic $41,737 |
| Mexican American Indians | 0.1 /100 | #286 | Tragic $41,719 |
| Indonesians | 0.1 /100 | #287 | Tragic $41,701 |
| Immigrants | Dominican Republic | 0.1 /100 | #288 | Tragic $41,554 |
| Comanche | 0.1 /100 | #289 | Tragic $41,519 |
| Paiute | 0.1 /100 | #290 | Tragic $41,508 |
| Central American Indians | 0.1 /100 | #291 | Tragic $41,474 |
| U.S. Virgin Islanders | 0.1 /100 | #292 | Tragic $41,448 |
| Immigrants | Zaire | 0.1 /100 | #293 | Tragic $41,325 |
| Potawatomi | 0.1 /100 | #294 | Tragic $41,288 |
| Bangladeshis | 0.1 /100 | #295 | Tragic $41,263 |
| Cherokee | 0.1 /100 | #296 | Tragic $41,252 |