Cherokee vs Immigrants from Israel Median Earnings

COMPARE

Cherokee
Race
Ancestry
AfghanAfricanAlaska NativeAlaskan AthabascanAlbanianAleutAlsatianAmericanApacheArabArapahoArgentineanArmenianAssyrian/Chaldean/SyriacAustralianAustrianBahamianBangladeshiBarbadianBasqueBelgianBelizeanBermudanBhutaneseBlackfeetBolivianBrazilianBritishBritish West IndianBulgarianBurmeseCajunCambodianCanadianCape VerdeanCarpatho RusynCelticCentral AmericanCentral American IndianCherokeeCheyenneChickasawChileanChineseChippewaChoctawColombianColvilleComancheCosta RicanCreeCreekCroatianCrowCubanCypriotCzechCzechoslovakianDanishDelawareDominicanDutchDutch West IndianEastern EuropeanEcuadorianEgyptianEnglishEstonianEthiopianEuropeanFijianFilipinoFinnishFrenchFrench American IndianFrench CanadianGermanGerman RussianGhanaianGreekGuamanian/ChamorroGuatemalanGuyaneseHaitianHmongHonduranHopiHoumaHungarianIcelanderIndian (Asian)IndonesianInupiatIranianIraqiIrishIroquoisIsraeliItalianJamaicanJapaneseJordanianKenyanKiowaKoreanLaotianLatvianLebaneseLiberianLithuanianLumbeeLuxembourgerMacedonianMalaysianMalteseMarshalleseMenomineeMexicanMexican American IndianMongolianMoroccanNative HawaiianNavajoNepaleseNew ZealanderNicaraguanNigerianNorthern EuropeanNorwegianOkinawanOsageOttawaPaiutePakistaniPalestinianPanamanianParaguayanPennsylvania GermanPeruvianPimaPolishPortuguesePotawatomiPuebloPuerto RicanPuget Sound SalishRomanianRussianSalvadoranSamoanScandinavianScotch-IrishScottishSeminoleSenegaleseSerbianShoshoneSierra LeoneanSiouxSlavicSlovakSloveneSomaliSouth AfricanSouth AmericanSouth American IndianSoviet UnionSpaniardSpanishSpanish AmericanSpanish American IndianSri LankanSubsaharan AfricanSudaneseSwedishSwissSyrianTaiwaneseThaiTlingit-HaidaTohono O'OdhamTonganTrinidadian and TobagonianTsimshianTurkishU.S. Virgin IslanderUgandanUkrainianUruguayanUteVenezuelanVietnameseWelshWest IndianYakamaYaquiYugoslavianYumanYup'ikZimbabwean
Immigration
NonimmigrantsImmigrantsAfghanistanAfricaAlbaniaArgentinaArmeniaAsiaAustraliaAustriaBahamasBangladeshBarbadosBelarusBelgiumBelizeBoliviaBosnia and HerzegovinaBrazilBulgariaBurma/MyanmarCabo VerdeCambodiaCameroonCanadaCaribbeanCentral AmericaChileChinaColombiaCongoCosta RicaCroatiaCubaCzechoslovakiaDenmarkDominicaDominican RepublicEastern AfricaEastern AsiaEastern EuropeEcuadorEgyptEl SalvadorEnglandEritreaEthiopiaEuropeFijiFranceGermanyGhanaGreeceGrenadaGuatemalaGuyanaHaitiHondurasHong KongHungaryIndiaIndonesiaIranIraqIrelandItalyJamaicaJapanJordanKazakhstanKenyaKoreaKuwaitLaosLatin AmericaLatviaLebanonLiberiaLithuaniaMalaysiaMexicoMicronesiaMiddle AfricaMoldovaMoroccoNepalNetherlandsNicaraguaNigeriaNorth AmericaNorth MacedoniaNorthern AfricaNorthern EuropeNorwayOceaniaPakistanPanamaPeruPhilippinesPolandPortugalRomaniaRussiaSaudi ArabiaScotlandSenegalSerbiaSierra LeoneSingaporeSomaliaSouth AfricaSouth AmericaSouth Central AsiaSouth Eastern AsiaSouthern EuropeSpainSri LankaSt. Vincent and the GrenadinesSudanSwedenSwitzerlandSyriaTaiwanThailandTrinidad and TobagoTurkeyUgandaUkraineUruguayUzbekistanVenezuelaVietnamWest IndiesWestern AfricaWestern AsiaWestern EuropeYemenZaireZimbabweAzores
Immigrants from Israel
Race
Ancestry
AfghanAfricanAlaska NativeAlaskan AthabascanAlbanianAleutAlsatianAmericanApacheArabArapahoArgentineanArmenianAssyrian/Chaldean/SyriacAustralianAustrianBahamianBangladeshiBarbadianBasqueBelgianBelizeanBermudanBhutaneseBlackfeetBolivianBrazilianBritishBritish West IndianBulgarianBurmeseCajunCambodianCanadianCape VerdeanCarpatho RusynCelticCentral AmericanCentral American IndianCheyenneChickasawChileanChineseChippewaChoctawColombianColvilleComancheCosta RicanCreeCreekCroatianCrowCubanCypriotCzechCzechoslovakianDanishDelawareDominicanDutchDutch West IndianEastern EuropeanEcuadorianEgyptianEnglishEstonianEthiopianEuropeanFijianFilipinoFinnishFrenchFrench American IndianFrench CanadianGermanGerman RussianGhanaianGreekGuamanian/ChamorroGuatemalanGuyaneseHaitianHmongHonduranHopiHoumaHungarianIcelanderIndian (Asian)IndonesianInupiatIranianIraqiIrishIroquoisIsraeliItalianJamaicanJapaneseJordanianKenyanKiowaKoreanLaotianLatvianLebaneseLiberianLithuanianLumbeeLuxembourgerMacedonianMalaysianMalteseMarshalleseMenomineeMexicanMexican American IndianMongolianMoroccanNative HawaiianNavajoNepaleseNew ZealanderNicaraguanNigerianNorthern EuropeanNorwegianOkinawanOsageOttawaPaiutePakistaniPalestinianPanamanianParaguayanPennsylvania GermanPeruvianPimaPolishPortuguesePotawatomiPuebloPuerto RicanPuget Sound SalishRomanianRussianSalvadoranSamoanScandinavianScotch-IrishScottishSeminoleSenegaleseSerbianShoshoneSierra LeoneanSiouxSlavicSlovakSloveneSomaliSouth AfricanSouth AmericanSouth American IndianSoviet UnionSpaniardSpanishSpanish AmericanSpanish American IndianSri LankanSubsaharan AfricanSudaneseSwedishSwissSyrianTaiwaneseThaiTlingit-HaidaTohono O'OdhamTonganTrinidadian and TobagonianTsimshianTurkishU.S. Virgin IslanderUgandanUkrainianUruguayanUteVenezuelanVietnameseWelshWest IndianYakamaYaquiYugoslavianYumanYup'ikZimbabwean
Immigration
NonimmigrantsImmigrantsAfghanistanAfricaAlbaniaArgentinaArmeniaAsiaAustraliaAustriaBahamasBangladeshBarbadosBelarusBelgiumBelizeBoliviaBosnia and HerzegovinaBrazilBulgariaBurma/MyanmarCabo VerdeCambodiaCameroonCanadaCaribbeanCentral AmericaChileChinaColombiaCongoCosta RicaCroatiaCubaCzechoslovakiaDenmarkDominicaDominican RepublicEastern AfricaEastern AsiaEastern EuropeEcuadorEgyptEl SalvadorEnglandEritreaEthiopiaEuropeFijiFranceGermanyGhanaGreeceGrenadaGuatemalaGuyanaHaitiHondurasHong KongHungaryIndiaIndonesiaIranIraqIrelandIsraelItalyJamaicaJapanJordanKazakhstanKenyaKoreaKuwaitLaosLatin AmericaLatviaLebanonLiberiaLithuaniaMalaysiaMexicoMicronesiaMiddle AfricaMoldovaMoroccoNepalNetherlandsNicaraguaNigeriaNorth AmericaNorth MacedoniaNorthern AfricaNorthern EuropeNorwayOceaniaPakistanPanamaPeruPhilippinesPolandPortugalRomaniaRussiaSaudi ArabiaScotlandSenegalSerbiaSierra LeoneSingaporeSomaliaSouth AfricaSouth AmericaSouth Central AsiaSouth Eastern AsiaSouthern EuropeSpainSri LankaSt. Vincent and the GrenadinesSudanSwedenSwitzerlandSyriaTaiwanThailandTrinidad and TobagoTurkeyUgandaUkraineUruguayUzbekistanVenezuelaVietnamWest IndiesWestern AfricaWestern AsiaWestern EuropeYemenZaireZimbabweAzores
Median Earnings
Income
Poverty
Unemployment
Labor Participation
Family Structure
Vehicle Availability
Education Level
Disability

Median Earnings Comparison

Cherokee

Immigrants from Israel

Tragic
Exceptional
$41,252
MEDIAN EARNINGS
0.1/ 100
METRIC RATING
296th/ 347
METRIC RANK
$57,034
MEDIAN EARNINGS
100.0/ 100
METRIC RATING
11th/ 347
METRIC RANK

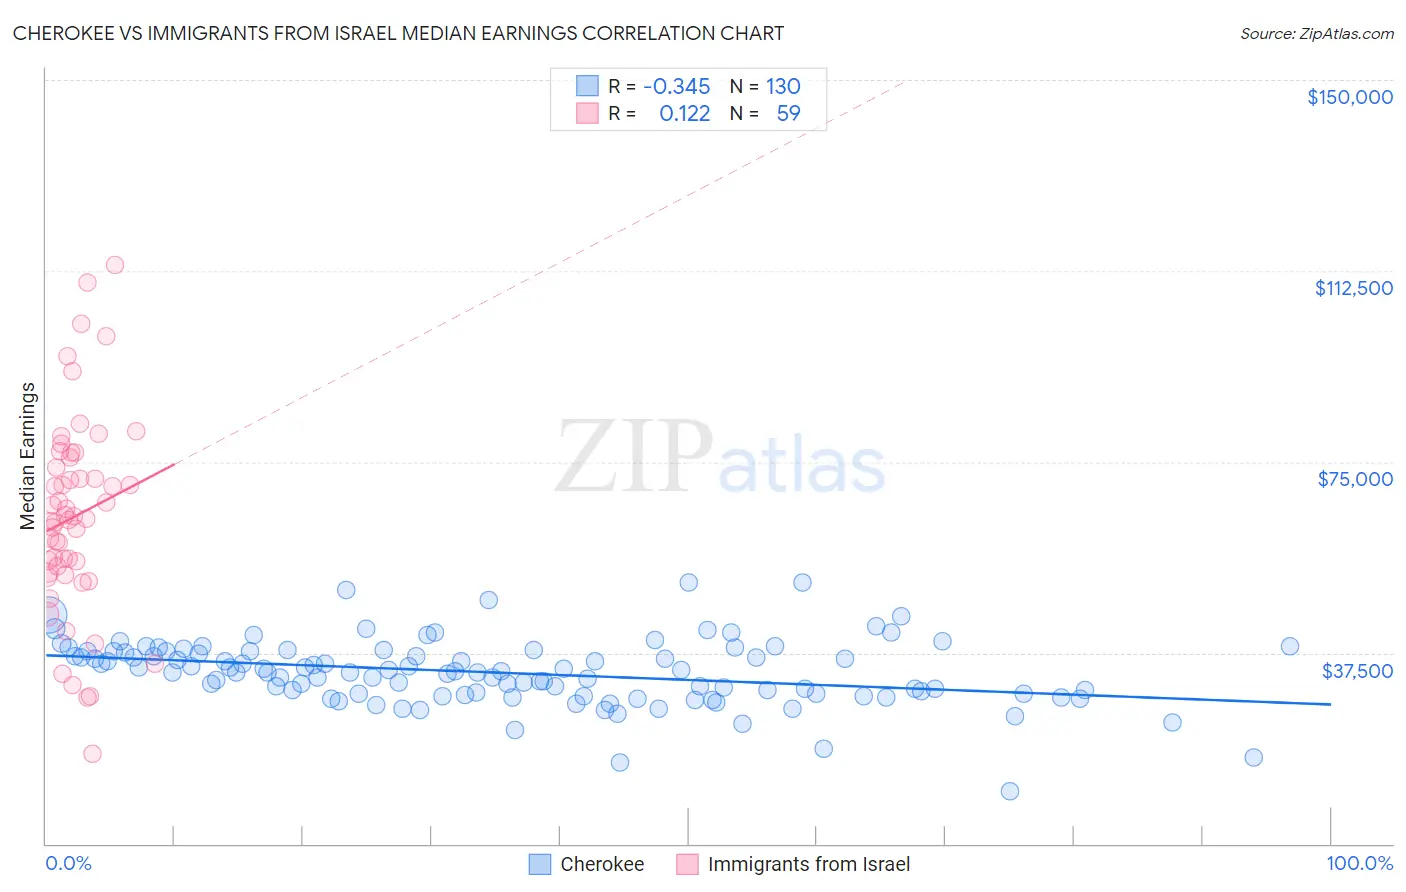
Cherokee vs Immigrants from Israel Median Earnings Correlation Chart

The statistical analysis conducted on geographies consisting of 493,557,174 people shows a mild negative correlation between the proportion of Cherokee and median earnings in the United States with a correlation coefficient (R) of -0.345 and weighted average of $41,252. Similarly, the statistical analysis conducted on geographies consisting of 210,025,881 people shows a poor positive correlation between the proportion of Immigrants from Israel and median earnings in the United States with a correlation coefficient (R) of 0.122 and weighted average of $57,034, a difference of 38.3%.
Cherokee vs Immigrants from Israel Median Earnings

Median Earnings Correlation Summary

MeasurementCherokeeImmigrants from Israel
Minimum$10,267$17,782
Maximum$51,250$113,636
Range$40,983$95,854
Mean$33,603$64,255
Median$33,784$63,844
Interquartile 25% (IQ1)$29,375$53,296
Interquartile 75% (IQ3)$37,767$75,870
Interquartile Range (IQR)$8,392$22,574
Standard Deviation (Sample)$6,429$19,481
Standard Deviation (Population)$6,404$19,315

Similar Demographics by Median Earnings

Demographics Similar to Cherokee by Median Earnings

In terms of median earnings, the demographic groups most similar to Cherokee are Bangladeshi ($41,263, a difference of 0.030%), Potawatomi ($41,288, a difference of 0.090%), Guatemalan ($41,205, a difference of 0.11%), Immigrants from Zaire ($41,325, a difference of 0.18%), and Immigrants from Micronesia ($41,133, a difference of 0.29%).
DemographicsRating | RankMedian Earnings
Comanche
0.1
/100
|
#289
Tragic
$41,519
Paiute
0.1
/100
|
#290
Tragic
$41,508
Central American Indians
0.1
/100
|
#291
Tragic
$41,474
U.S. Virgin Islanders
0.1
/100
|
#292
Tragic
$41,448
Immigrants | Zaire
0.1
/100
|
#293
Tragic
$41,325
Potawatomi
0.1
/100
|
#294
Tragic
$41,288
Bangladeshis
0.1
/100
|
#295
Tragic
$41,263
Cherokee
0.1
/100
|
#296
Tragic
$41,252
Guatemalans
0.1
/100
|
#297
Tragic
$41,205
Immigrants | Micronesia
0.1
/100
|
#298
Tragic
$41,133
Immigrants | Caribbean
0.1
/100
|
#299
Tragic
$41,119
Ute
0.1
/100
|
#300
Tragic
$41,051
Immigrants | Latin America
0.1
/100
|
#301
Tragic
$41,049
Shoshone
0.0
/100
|
#302
Tragic
$40,932
Haitians
0.0
/100
|
#303
Tragic
$40,918

Demographics Similar to Immigrants from Israel by Median Earnings

In terms of median earnings, the demographic groups most similar to Immigrants from Israel are Immigrants from South Central Asia ($57,114, a difference of 0.14%), Immigrants from Ireland ($56,854, a difference of 0.32%), Immigrants from China ($56,638, a difference of 0.70%), Okinawan ($57,550, a difference of 0.90%), and Immigrants from Iran ($57,612, a difference of 1.0%).
DemographicsRating | RankMedian Earnings
Immigrants | Hong Kong
100.0
/100
|
#4
Exceptional
$59,433
Thais
100.0
/100
|
#5
Exceptional
$59,237
Immigrants | Singapore
100.0
/100
|
#6
Exceptional
$59,038
Iranians
100.0
/100
|
#7
Exceptional
$58,474
Immigrants | Iran
100.0
/100
|
#8
Exceptional
$57,612
Okinawans
100.0
/100
|
#9
Exceptional
$57,550
Immigrants | South Central Asia
100.0
/100
|
#10
Exceptional
$57,114
Immigrants | Israel
100.0
/100
|
#11
Exceptional
$57,034
Immigrants | Ireland
100.0
/100
|
#12
Exceptional
$56,854
Immigrants | China
100.0
/100
|
#13
Exceptional
$56,638
Immigrants | Australia
100.0
/100
|
#14
Exceptional
$56,305
Indians (Asian)
100.0
/100
|
#15
Exceptional
$56,253
Immigrants | Eastern Asia
100.0
/100
|
#16
Exceptional
$56,183
Eastern Europeans
100.0
/100
|
#17
Exceptional
$55,084
Immigrants | Japan
100.0
/100
|
#18
Exceptional
$54,938