Cherokee vs New Zealander Median Household Income
COMPARE
Cherokee
New Zealander
Median Household Income
Median Household Income Comparison
Cherokee
New Zealanders
$72,682
MEDIAN HOUSEHOLD INCOME
0.0/ 100
METRIC RATING
301st/ 347
METRIC RANK
$95,146
MEDIAN HOUSEHOLD INCOME
99.8/ 100
METRIC RATING
57th/ 347
METRIC RANK
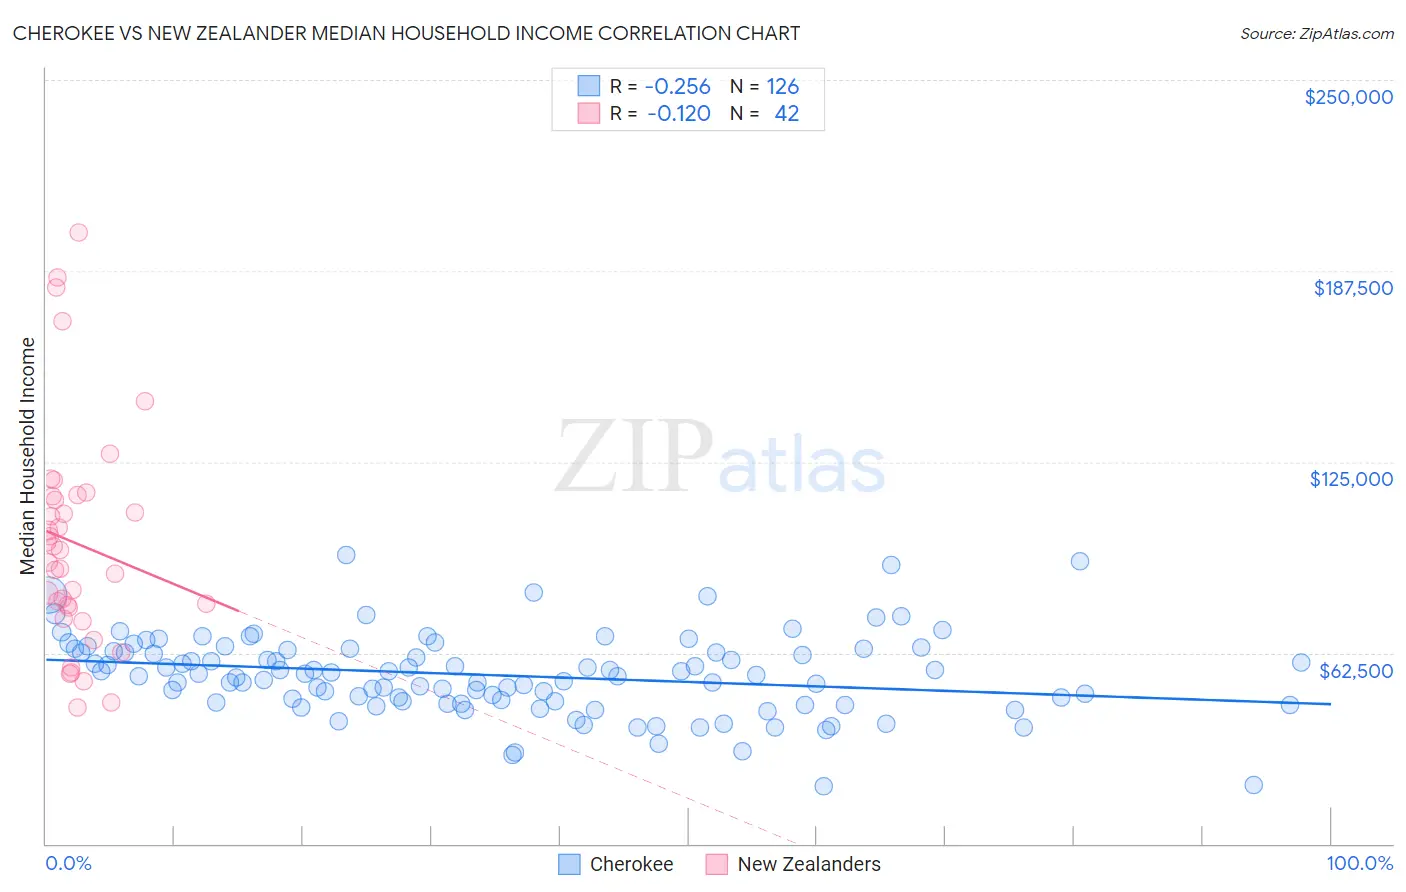
Cherokee vs New Zealander Median Household Income Correlation Chart
The statistical analysis conducted on geographies consisting of 493,197,550 people shows a weak negative correlation between the proportion of Cherokee and median household income in the United States with a correlation coefficient (R) of -0.256 and weighted average of $72,682. Similarly, the statistical analysis conducted on geographies consisting of 106,891,661 people shows a poor negative correlation between the proportion of New Zealanders and median household income in the United States with a correlation coefficient (R) of -0.120 and weighted average of $95,146, a difference of 30.9%.
Median Household Income Correlation Summary
| Measurement | Cherokee | New Zealander |
| Minimum | $18,882 | $44,447 |
| Maximum | $94,371 | $200,054 |
| Range | $75,489 | $155,607 |
| Mean | $55,165 | $98,486 |
| Median | $55,481 | $94,049 |
| Interquartile 25% (IQ1) | $46,693 | $77,381 |
| Interquartile 75% (IQ3) | $63,415 | $113,735 |
| Interquartile Range (IQR) | $16,722 | $36,354 |
| Standard Deviation (Sample) | $13,237 | $36,469 |
| Standard Deviation (Population) | $13,185 | $36,032 |
Similar Demographics by Median Household Income
Demographics Similar to Cherokee by Median Household Income
In terms of median household income, the demographic groups most similar to Cherokee are Shoshone ($72,660, a difference of 0.030%), African ($72,650, a difference of 0.040%), Immigrants from Dominica ($72,760, a difference of 0.11%), Immigrants from Haiti ($72,599, a difference of 0.11%), and Honduran ($72,588, a difference of 0.13%).
| Demographics | Rating | Rank | Median Household Income |
| Blackfeet | 0.1 /100 | #294 | Tragic $73,509 |
| Cubans | 0.1 /100 | #295 | Tragic $73,392 |
| Haitians | 0.1 /100 | #296 | Tragic $73,306 |
| Immigrants | Mexico | 0.0 /100 | #297 | Tragic $73,160 |
| Paiute | 0.0 /100 | #298 | Tragic $72,959 |
| Indonesians | 0.0 /100 | #299 | Tragic $72,856 |
| Immigrants | Dominica | 0.0 /100 | #300 | Tragic $72,760 |
| Cherokee | 0.0 /100 | #301 | Tragic $72,682 |
| Shoshone | 0.0 /100 | #302 | Tragic $72,660 |
| Africans | 0.0 /100 | #303 | Tragic $72,650 |
| Immigrants | Haiti | 0.0 /100 | #304 | Tragic $72,599 |
| Hondurans | 0.0 /100 | #305 | Tragic $72,588 |
| Potawatomi | 0.0 /100 | #306 | Tragic $72,576 |
| Ute | 0.0 /100 | #307 | Tragic $72,402 |
| Yakama | 0.0 /100 | #308 | Tragic $72,225 |
Demographics Similar to New Zealanders by Median Household Income
In terms of median household income, the demographic groups most similar to New Zealanders are Soviet Union ($95,098, a difference of 0.050%), Immigrants from Europe ($95,032, a difference of 0.12%), Korean ($95,018, a difference of 0.13%), Immigrants from Austria ($95,277, a difference of 0.14%), and Laotian ($94,990, a difference of 0.16%).
| Demographics | Rating | Rank | Median Household Income |
| Bulgarians | 99.9 /100 | #50 | Exceptional $96,290 |
| Estonians | 99.9 /100 | #51 | Exceptional $95,930 |
| Immigrants | South Africa | 99.9 /100 | #52 | Exceptional $95,800 |
| Paraguayans | 99.9 /100 | #53 | Exceptional $95,737 |
| Egyptians | 99.9 /100 | #54 | Exceptional $95,673 |
| Immigrants | Czechoslovakia | 99.9 /100 | #55 | Exceptional $95,319 |
| Immigrants | Austria | 99.9 /100 | #56 | Exceptional $95,277 |
| New Zealanders | 99.8 /100 | #57 | Exceptional $95,146 |
| Soviet Union | 99.8 /100 | #58 | Exceptional $95,098 |
| Immigrants | Europe | 99.8 /100 | #59 | Exceptional $95,032 |
| Koreans | 99.8 /100 | #60 | Exceptional $95,018 |
| Laotians | 99.8 /100 | #61 | Exceptional $94,990 |
| Immigrants | Norway | 99.8 /100 | #62 | Exceptional $94,846 |
| Greeks | 99.8 /100 | #63 | Exceptional $94,735 |
| Immigrants | Netherlands | 99.7 /100 | #64 | Exceptional $94,411 |