Chilean vs New Zealander Median Household Income
COMPARE
Chilean
New Zealander
Median Household Income
Median Household Income Comparison
Chileans
New Zealanders
$90,605
MEDIAN HOUSEHOLD INCOME
97.2/ 100
METRIC RATING
109th/ 347
METRIC RANK
$95,146
MEDIAN HOUSEHOLD INCOME
99.8/ 100
METRIC RATING
57th/ 347
METRIC RANK
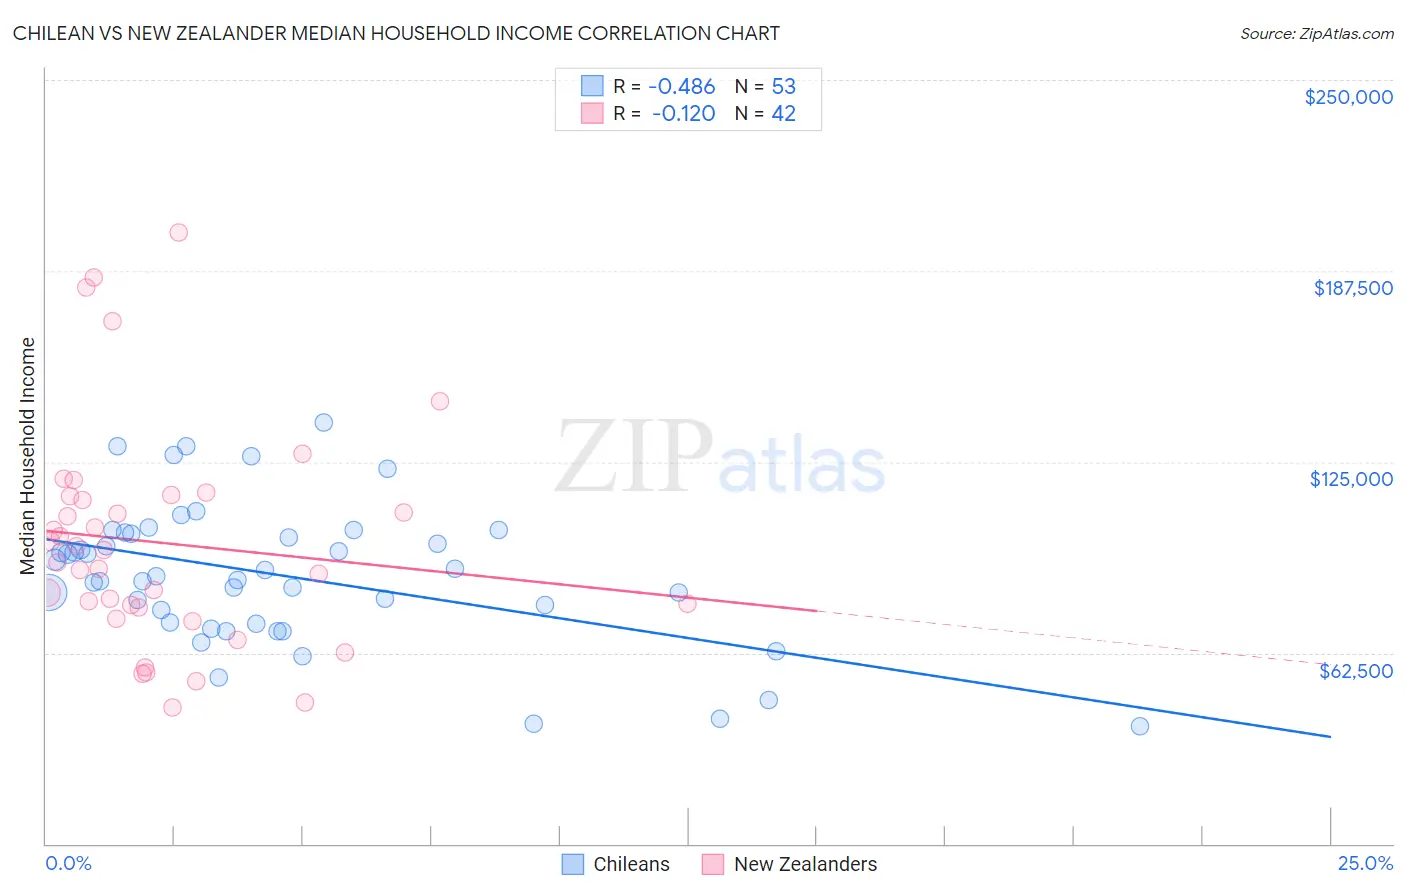
Chilean vs New Zealander Median Household Income Correlation Chart
The statistical analysis conducted on geographies consisting of 256,490,750 people shows a moderate negative correlation between the proportion of Chileans and median household income in the United States with a correlation coefficient (R) of -0.486 and weighted average of $90,605. Similarly, the statistical analysis conducted on geographies consisting of 106,891,661 people shows a poor negative correlation between the proportion of New Zealanders and median household income in the United States with a correlation coefficient (R) of -0.120 and weighted average of $95,146, a difference of 5.0%.
Median Household Income Correlation Summary
| Measurement | Chilean | New Zealander |
| Minimum | $38,281 | $44,447 |
| Maximum | $138,054 | $200,054 |
| Range | $99,773 | $155,607 |
| Mean | $87,931 | $98,486 |
| Median | $87,519 | $94,049 |
| Interquartile 25% (IQ1) | $72,343 | $77,381 |
| Interquartile 75% (IQ3) | $101,615 | $113,735 |
| Interquartile Range (IQR) | $29,272 | $36,354 |
| Standard Deviation (Sample) | $22,824 | $36,469 |
| Standard Deviation (Population) | $22,607 | $36,032 |
Similar Demographics by Median Household Income
Demographics Similar to Chileans by Median Household Income
In terms of median household income, the demographic groups most similar to Chileans are Zimbabwean ($90,618, a difference of 0.020%), Palestinian ($90,574, a difference of 0.030%), Immigrants from Poland ($90,549, a difference of 0.060%), Croatian ($90,685, a difference of 0.090%), and Macedonian ($90,761, a difference of 0.17%).
| Demographics | Rating | Rank | Median Household Income |
| Austrians | 98.2 /100 | #102 | Exceptional $91,339 |
| Immigrants | Ukraine | 98.0 /100 | #103 | Exceptional $91,124 |
| Immigrants | Kazakhstan | 97.8 /100 | #104 | Exceptional $91,015 |
| Immigrants | Brazil | 97.7 /100 | #105 | Exceptional $90,907 |
| Macedonians | 97.4 /100 | #106 | Exceptional $90,761 |
| Croatians | 97.3 /100 | #107 | Exceptional $90,685 |
| Zimbabweans | 97.2 /100 | #108 | Exceptional $90,618 |
| Chileans | 97.2 /100 | #109 | Exceptional $90,605 |
| Palestinians | 97.1 /100 | #110 | Exceptional $90,574 |
| Immigrants | Poland | 97.1 /100 | #111 | Exceptional $90,549 |
| Northern Europeans | 96.9 /100 | #112 | Exceptional $90,446 |
| Peruvians | 96.5 /100 | #113 | Exceptional $90,261 |
| Immigrants | Northern Africa | 95.9 /100 | #114 | Exceptional $90,026 |
| Immigrants | Western Asia | 95.9 /100 | #115 | Exceptional $90,005 |
| Native Hawaiians | 95.7 /100 | #116 | Exceptional $89,919 |
Demographics Similar to New Zealanders by Median Household Income
In terms of median household income, the demographic groups most similar to New Zealanders are Soviet Union ($95,098, a difference of 0.050%), Immigrants from Europe ($95,032, a difference of 0.12%), Korean ($95,018, a difference of 0.13%), Immigrants from Austria ($95,277, a difference of 0.14%), and Laotian ($94,990, a difference of 0.16%).
| Demographics | Rating | Rank | Median Household Income |
| Bulgarians | 99.9 /100 | #50 | Exceptional $96,290 |
| Estonians | 99.9 /100 | #51 | Exceptional $95,930 |
| Immigrants | South Africa | 99.9 /100 | #52 | Exceptional $95,800 |
| Paraguayans | 99.9 /100 | #53 | Exceptional $95,737 |
| Egyptians | 99.9 /100 | #54 | Exceptional $95,673 |
| Immigrants | Czechoslovakia | 99.9 /100 | #55 | Exceptional $95,319 |
| Immigrants | Austria | 99.9 /100 | #56 | Exceptional $95,277 |
| New Zealanders | 99.8 /100 | #57 | Exceptional $95,146 |
| Soviet Union | 99.8 /100 | #58 | Exceptional $95,098 |
| Immigrants | Europe | 99.8 /100 | #59 | Exceptional $95,032 |
| Koreans | 99.8 /100 | #60 | Exceptional $95,018 |
| Laotians | 99.8 /100 | #61 | Exceptional $94,990 |
| Immigrants | Norway | 99.8 /100 | #62 | Exceptional $94,846 |
| Greeks | 99.8 /100 | #63 | Exceptional $94,735 |
| Immigrants | Netherlands | 99.7 /100 | #64 | Exceptional $94,411 |