Immigrants from Indonesia vs New Zealander Median Household Income
COMPARE
Immigrants from Indonesia
New Zealander
Median Household Income
Median Household Income Comparison
Immigrants from Indonesia
New Zealanders
$97,297
MEDIAN HOUSEHOLD INCOME
100.0/ 100
METRIC RATING
38th/ 347
METRIC RANK
$95,146
MEDIAN HOUSEHOLD INCOME
99.8/ 100
METRIC RATING
57th/ 347
METRIC RANK
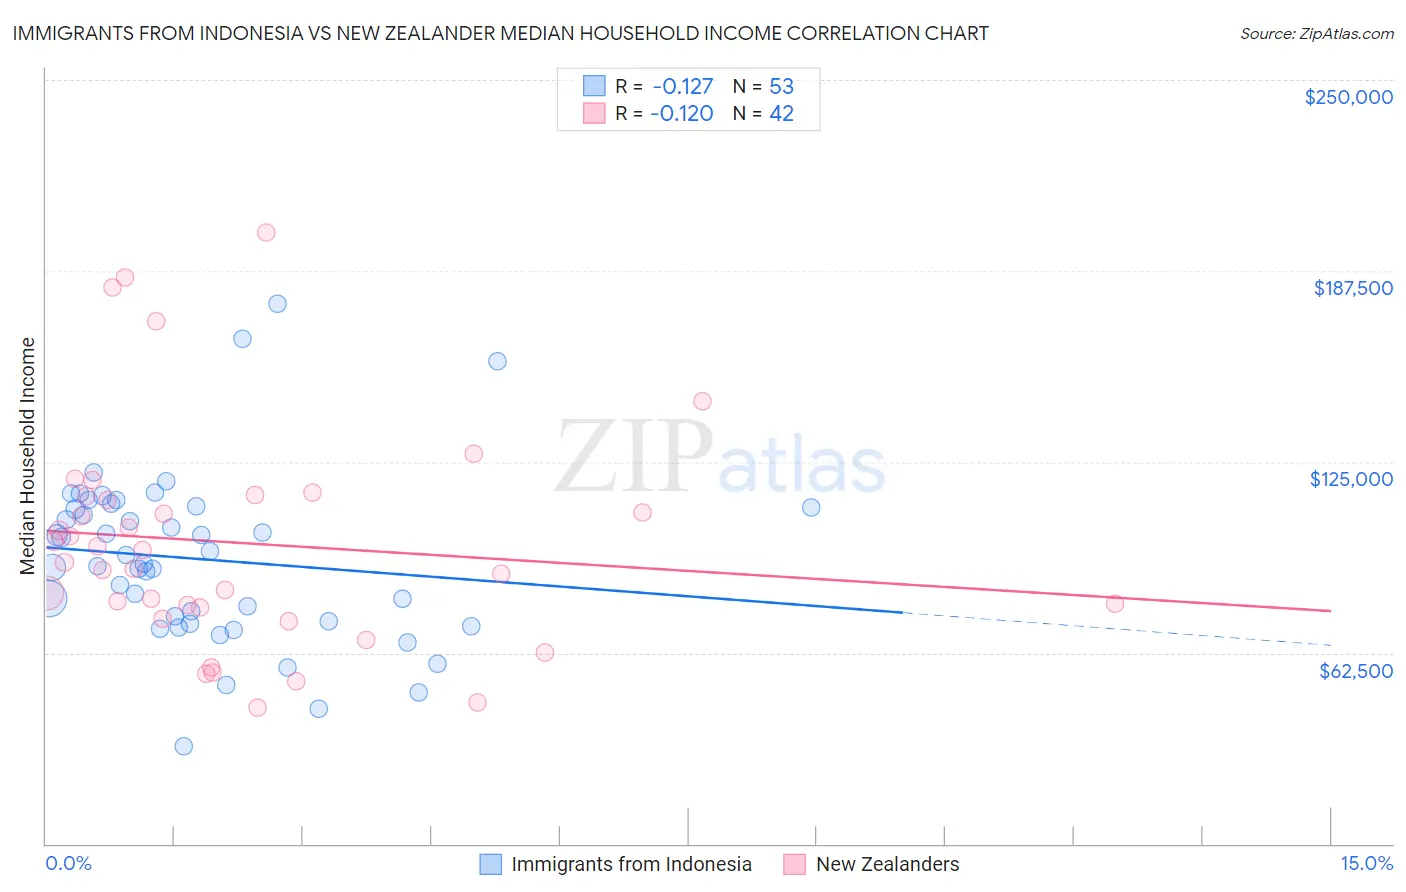
Immigrants from Indonesia vs New Zealander Median Household Income Correlation Chart
The statistical analysis conducted on geographies consisting of 215,679,873 people shows a poor negative correlation between the proportion of Immigrants from Indonesia and median household income in the United States with a correlation coefficient (R) of -0.127 and weighted average of $97,297. Similarly, the statistical analysis conducted on geographies consisting of 106,891,661 people shows a poor negative correlation between the proportion of New Zealanders and median household income in the United States with a correlation coefficient (R) of -0.120 and weighted average of $95,146, a difference of 2.3%.
Median Household Income Correlation Summary
| Measurement | Immigrants from Indonesia | New Zealander |
| Minimum | $31,861 | $44,447 |
| Maximum | $176,702 | $200,054 |
| Range | $144,840 | $155,607 |
| Mean | $93,146 | $98,486 |
| Median | $91,574 | $94,049 |
| Interquartile 25% (IQ1) | $72,477 | $77,381 |
| Interquartile 75% (IQ3) | $110,341 | $113,735 |
| Interquartile Range (IQR) | $37,864 | $36,354 |
| Standard Deviation (Sample) | $27,918 | $36,469 |
| Standard Deviation (Population) | $27,654 | $36,032 |
Demographics Similar to Immigrants from Indonesia and New Zealanders by Median Household Income
In terms of median household income, the demographic groups most similar to Immigrants from Indonesia are Latvian ($97,311, a difference of 0.010%), Afghan ($97,026, a difference of 0.28%), Maltese ($97,015, a difference of 0.29%), Immigrants from Turkey ($96,964, a difference of 0.34%), and Immigrants from Lithuania ($96,836, a difference of 0.48%). Similarly, the demographic groups most similar to New Zealanders are Immigrants from Austria ($95,277, a difference of 0.14%), Immigrants from Czechoslovakia ($95,319, a difference of 0.18%), Egyptian ($95,673, a difference of 0.55%), Paraguayan ($95,737, a difference of 0.62%), and Immigrants from South Africa ($95,800, a difference of 0.69%).
| Demographics | Rating | Rank | Median Household Income |
| Latvians | 100.0 /100 | #37 | Exceptional $97,311 |
| Immigrants | Indonesia | 100.0 /100 | #38 | Exceptional $97,297 |
| Afghans | 100.0 /100 | #39 | Exceptional $97,026 |
| Maltese | 100.0 /100 | #40 | Exceptional $97,015 |
| Immigrants | Turkey | 100.0 /100 | #41 | Exceptional $96,964 |
| Immigrants | Lithuania | 99.9 /100 | #42 | Exceptional $96,836 |
| Immigrants | France | 99.9 /100 | #43 | Exceptional $96,743 |
| Immigrants | Greece | 99.9 /100 | #44 | Exceptional $96,675 |
| Israelis | 99.9 /100 | #45 | Exceptional $96,552 |
| Australians | 99.9 /100 | #46 | Exceptional $96,490 |
| Immigrants | Russia | 99.9 /100 | #47 | Exceptional $96,378 |
| Cambodians | 99.9 /100 | #48 | Exceptional $96,324 |
| Immigrants | Malaysia | 99.9 /100 | #49 | Exceptional $96,292 |
| Bulgarians | 99.9 /100 | #50 | Exceptional $96,290 |
| Estonians | 99.9 /100 | #51 | Exceptional $95,930 |
| Immigrants | South Africa | 99.9 /100 | #52 | Exceptional $95,800 |
| Paraguayans | 99.9 /100 | #53 | Exceptional $95,737 |
| Egyptians | 99.9 /100 | #54 | Exceptional $95,673 |
| Immigrants | Czechoslovakia | 99.9 /100 | #55 | Exceptional $95,319 |
| Immigrants | Austria | 99.9 /100 | #56 | Exceptional $95,277 |
| New Zealanders | 99.8 /100 | #57 | Exceptional $95,146 |