Cherokee vs Immigrants from Canada Median Household Income
COMPARE
Cherokee
Immigrants from Canada
Median Household Income
Median Household Income Comparison
Cherokee
Immigrants from Canada
$72,682
MEDIAN HOUSEHOLD INCOME
0.0/ 100
METRIC RATING
301st/ 347
METRIC RANK
$92,029
MEDIAN HOUSEHOLD INCOME
98.8/ 100
METRIC RATING
88th/ 347
METRIC RANK
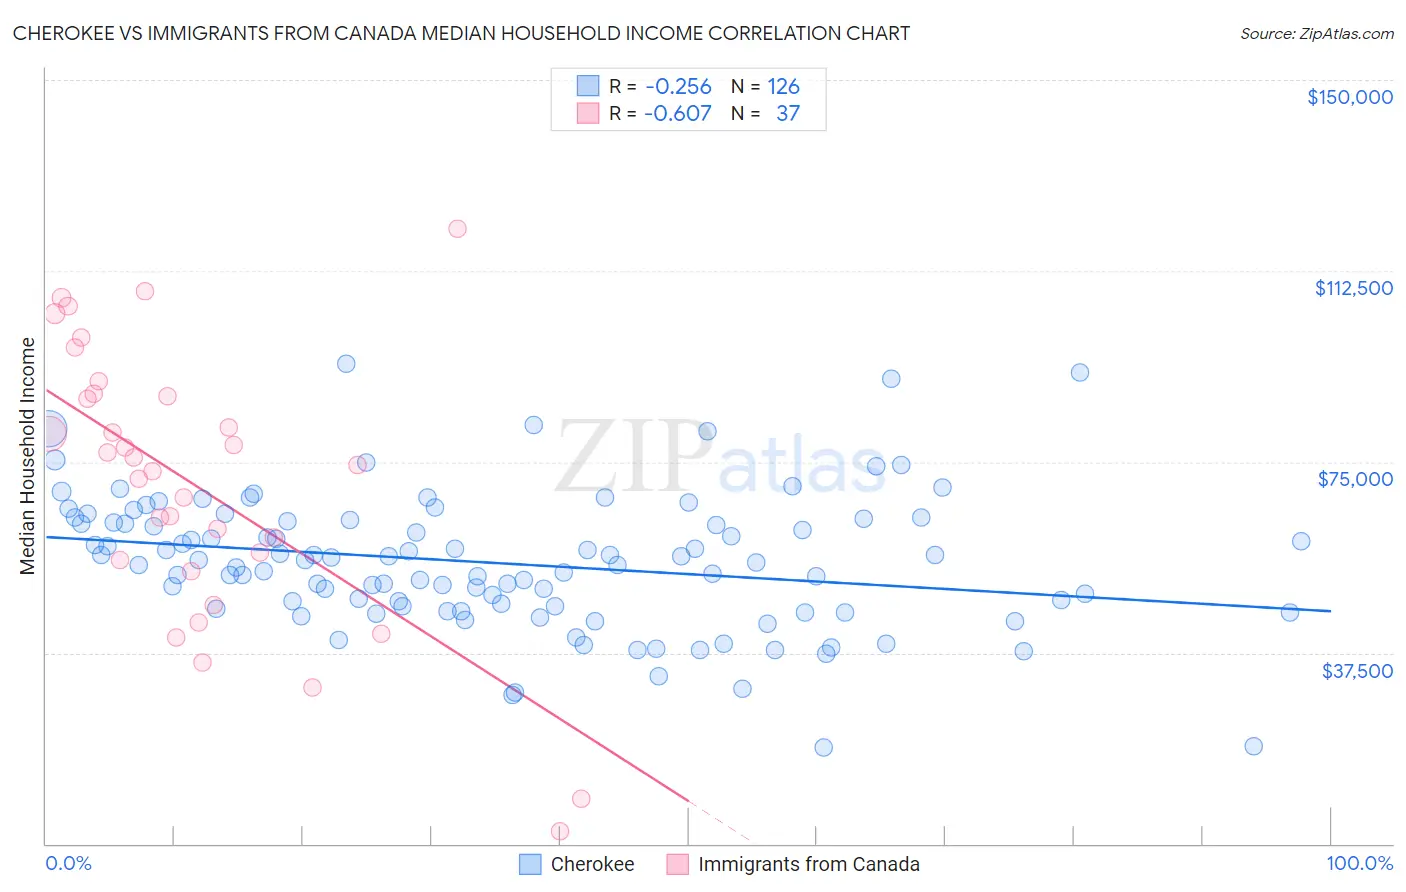
Cherokee vs Immigrants from Canada Median Household Income Correlation Chart
The statistical analysis conducted on geographies consisting of 493,197,550 people shows a weak negative correlation between the proportion of Cherokee and median household income in the United States with a correlation coefficient (R) of -0.256 and weighted average of $72,682. Similarly, the statistical analysis conducted on geographies consisting of 459,019,816 people shows a significant negative correlation between the proportion of Immigrants from Canada and median household income in the United States with a correlation coefficient (R) of -0.607 and weighted average of $92,029, a difference of 26.6%.
Median Household Income Correlation Summary
| Measurement | Cherokee | Immigrants from Canada |
| Minimum | $18,882 | $2,499 |
| Maximum | $94,371 | $120,804 |
| Range | $75,489 | $118,305 |
| Mean | $55,165 | $70,352 |
| Median | $55,481 | $74,400 |
| Interquartile 25% (IQ1) | $46,693 | $54,648 |
| Interquartile 75% (IQ3) | $63,415 | $88,077 |
| Interquartile Range (IQR) | $16,722 | $33,429 |
| Standard Deviation (Sample) | $13,237 | $27,047 |
| Standard Deviation (Population) | $13,185 | $26,679 |
Similar Demographics by Median Household Income
Demographics Similar to Cherokee by Median Household Income
In terms of median household income, the demographic groups most similar to Cherokee are Shoshone ($72,660, a difference of 0.030%), African ($72,650, a difference of 0.040%), Immigrants from Dominica ($72,760, a difference of 0.11%), Immigrants from Haiti ($72,599, a difference of 0.11%), and Honduran ($72,588, a difference of 0.13%).
| Demographics | Rating | Rank | Median Household Income |
| Blackfeet | 0.1 /100 | #294 | Tragic $73,509 |
| Cubans | 0.1 /100 | #295 | Tragic $73,392 |
| Haitians | 0.1 /100 | #296 | Tragic $73,306 |
| Immigrants | Mexico | 0.0 /100 | #297 | Tragic $73,160 |
| Paiute | 0.0 /100 | #298 | Tragic $72,959 |
| Indonesians | 0.0 /100 | #299 | Tragic $72,856 |
| Immigrants | Dominica | 0.0 /100 | #300 | Tragic $72,760 |
| Cherokee | 0.0 /100 | #301 | Tragic $72,682 |
| Shoshone | 0.0 /100 | #302 | Tragic $72,660 |
| Africans | 0.0 /100 | #303 | Tragic $72,650 |
| Immigrants | Haiti | 0.0 /100 | #304 | Tragic $72,599 |
| Hondurans | 0.0 /100 | #305 | Tragic $72,588 |
| Potawatomi | 0.0 /100 | #306 | Tragic $72,576 |
| Ute | 0.0 /100 | #307 | Tragic $72,402 |
| Yakama | 0.0 /100 | #308 | Tragic $72,225 |
Demographics Similar to Immigrants from Canada by Median Household Income
In terms of median household income, the demographic groups most similar to Immigrants from Canada are Romanian ($91,994, a difference of 0.040%), Assyrian/Chaldean/Syriac ($91,991, a difference of 0.040%), Immigrants from Vietnam ($91,987, a difference of 0.050%), Immigrants from Hungary ($92,094, a difference of 0.070%), and Immigrants from England ($92,098, a difference of 0.080%).
| Demographics | Rating | Rank | Median Household Income |
| Immigrants | Eastern Europe | 99.4 /100 | #81 | Exceptional $93,051 |
| Immigrants | Spain | 99.3 /100 | #82 | Exceptional $92,732 |
| Italians | 99.1 /100 | #83 | Exceptional $92,475 |
| Immigrants | Argentina | 99.1 /100 | #84 | Exceptional $92,417 |
| Immigrants | Croatia | 99.0 /100 | #85 | Exceptional $92,225 |
| Immigrants | England | 98.9 /100 | #86 | Exceptional $92,098 |
| Immigrants | Hungary | 98.9 /100 | #87 | Exceptional $92,094 |
| Immigrants | Canada | 98.8 /100 | #88 | Exceptional $92,029 |
| Romanians | 98.8 /100 | #89 | Exceptional $91,994 |
| Assyrians/Chaldeans/Syriacs | 98.8 /100 | #90 | Exceptional $91,991 |
| Immigrants | Vietnam | 98.8 /100 | #91 | Exceptional $91,987 |
| Immigrants | Western Europe | 98.8 /100 | #92 | Exceptional $91,936 |
| Immigrants | Lebanon | 98.7 /100 | #93 | Exceptional $91,887 |
| Immigrants | North America | 98.7 /100 | #94 | Exceptional $91,860 |
| Armenians | 98.7 /100 | #95 | Exceptional $91,807 |