Cherokee vs Choctaw Median Household Income
COMPARE
Cherokee
Choctaw
Median Household Income
Median Household Income Comparison
Cherokee
Choctaw
$72,682
MEDIAN HOUSEHOLD INCOME
0.0/ 100
METRIC RATING
301st/ 347
METRIC RANK
$69,947
MEDIAN HOUSEHOLD INCOME
0.0/ 100
METRIC RATING
322nd/ 347
METRIC RANK
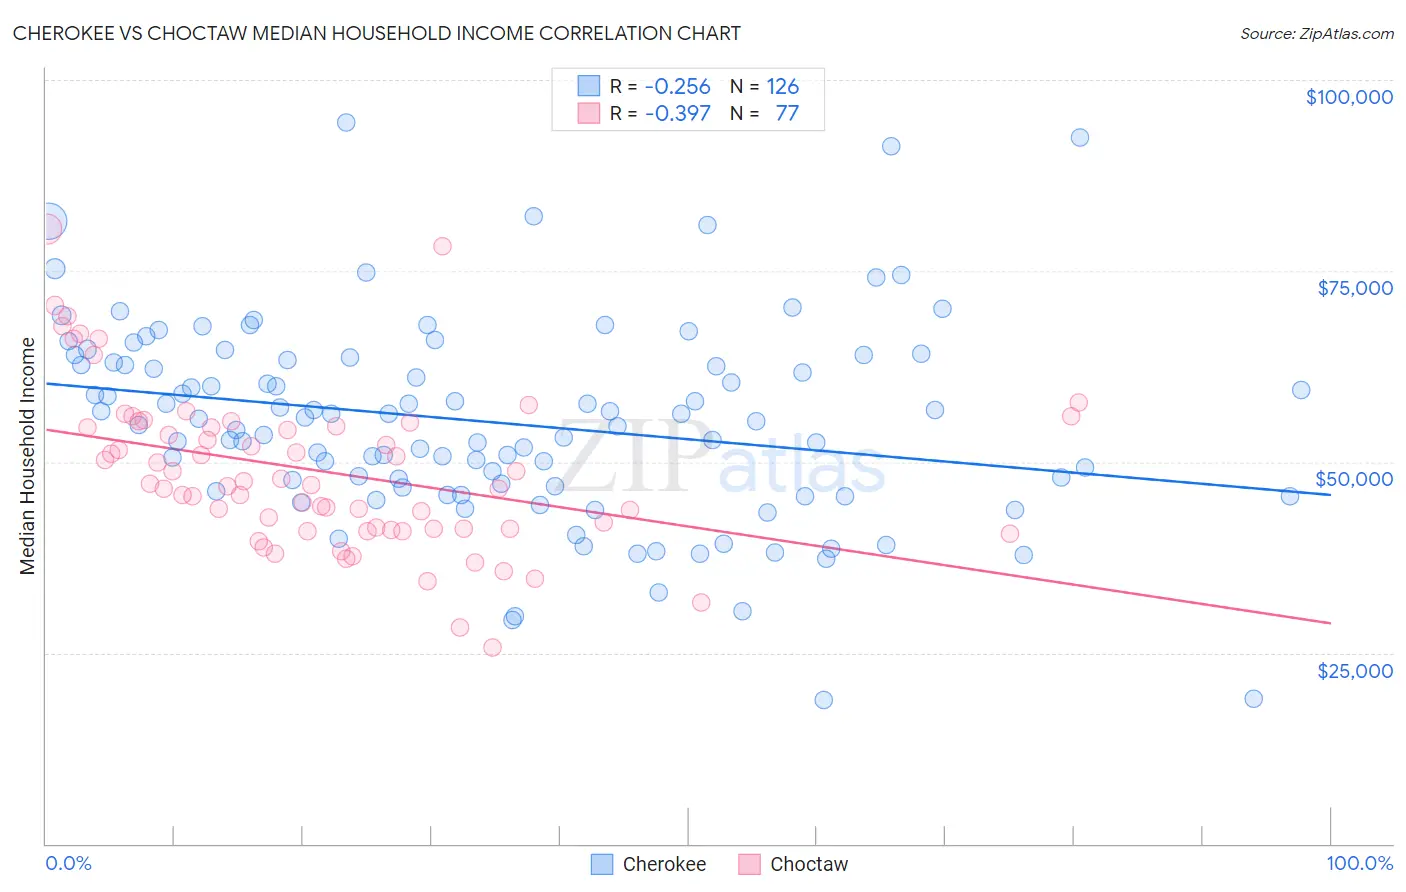
Cherokee vs Choctaw Median Household Income Correlation Chart
The statistical analysis conducted on geographies consisting of 493,197,550 people shows a weak negative correlation between the proportion of Cherokee and median household income in the United States with a correlation coefficient (R) of -0.256 and weighted average of $72,682. Similarly, the statistical analysis conducted on geographies consisting of 269,579,280 people shows a mild negative correlation between the proportion of Choctaw and median household income in the United States with a correlation coefficient (R) of -0.397 and weighted average of $69,947, a difference of 3.9%.
Median Household Income Correlation Summary
| Measurement | Cherokee | Choctaw |
| Minimum | $18,882 | $25,625 |
| Maximum | $94,371 | $80,457 |
| Range | $75,489 | $54,832 |
| Mean | $55,165 | $48,786 |
| Median | $55,481 | $47,101 |
| Interquartile 25% (IQ1) | $46,693 | $41,215 |
| Interquartile 75% (IQ3) | $63,415 | $54,919 |
| Interquartile Range (IQR) | $16,722 | $13,705 |
| Standard Deviation (Sample) | $13,237 | $10,591 |
| Standard Deviation (Population) | $13,185 | $10,522 |
Similar Demographics by Median Household Income
Demographics Similar to Cherokee by Median Household Income
In terms of median household income, the demographic groups most similar to Cherokee are Shoshone ($72,660, a difference of 0.030%), African ($72,650, a difference of 0.040%), Immigrants from Dominica ($72,760, a difference of 0.11%), Immigrants from Haiti ($72,599, a difference of 0.11%), and Honduran ($72,588, a difference of 0.13%).
| Demographics | Rating | Rank | Median Household Income |
| Blackfeet | 0.1 /100 | #294 | Tragic $73,509 |
| Cubans | 0.1 /100 | #295 | Tragic $73,392 |
| Haitians | 0.1 /100 | #296 | Tragic $73,306 |
| Immigrants | Mexico | 0.0 /100 | #297 | Tragic $73,160 |
| Paiute | 0.0 /100 | #298 | Tragic $72,959 |
| Indonesians | 0.0 /100 | #299 | Tragic $72,856 |
| Immigrants | Dominica | 0.0 /100 | #300 | Tragic $72,760 |
| Cherokee | 0.0 /100 | #301 | Tragic $72,682 |
| Shoshone | 0.0 /100 | #302 | Tragic $72,660 |
| Africans | 0.0 /100 | #303 | Tragic $72,650 |
| Immigrants | Haiti | 0.0 /100 | #304 | Tragic $72,599 |
| Hondurans | 0.0 /100 | #305 | Tragic $72,588 |
| Potawatomi | 0.0 /100 | #306 | Tragic $72,576 |
| Ute | 0.0 /100 | #307 | Tragic $72,402 |
| Yakama | 0.0 /100 | #308 | Tragic $72,225 |
Demographics Similar to Choctaw by Median Household Income
In terms of median household income, the demographic groups most similar to Choctaw are Chickasaw ($70,005, a difference of 0.080%), Colville ($70,094, a difference of 0.21%), Bahamian ($69,726, a difference of 0.32%), Yup'ik ($69,695, a difference of 0.36%), and Immigrants from Dominican Republic ($70,208, a difference of 0.37%).
| Demographics | Rating | Rank | Median Household Income |
| Ottawa | 0.0 /100 | #315 | Tragic $70,984 |
| Apache | 0.0 /100 | #316 | Tragic $70,927 |
| Cajuns | 0.0 /100 | #317 | Tragic $70,605 |
| Chippewa | 0.0 /100 | #318 | Tragic $70,539 |
| Immigrants | Dominican Republic | 0.0 /100 | #319 | Tragic $70,208 |
| Colville | 0.0 /100 | #320 | Tragic $70,094 |
| Chickasaw | 0.0 /100 | #321 | Tragic $70,005 |
| Choctaw | 0.0 /100 | #322 | Tragic $69,947 |
| Bahamians | 0.0 /100 | #323 | Tragic $69,726 |
| Yup'ik | 0.0 /100 | #324 | Tragic $69,695 |
| Seminole | 0.0 /100 | #325 | Tragic $69,420 |
| Yuman | 0.0 /100 | #326 | Tragic $68,743 |
| Immigrants | Cuba | 0.0 /100 | #327 | Tragic $68,461 |
| Menominee | 0.0 /100 | #328 | Tragic $68,423 |
| Dutch West Indians | 0.0 /100 | #329 | Tragic $68,412 |