Brazilian vs New Zealander Median Household Income
COMPARE
Brazilian
New Zealander
Median Household Income
Median Household Income Comparison
Brazilians
New Zealanders
$88,934
MEDIAN HOUSEHOLD INCOME
92.1/ 100
METRIC RATING
129th/ 347
METRIC RANK
$95,146
MEDIAN HOUSEHOLD INCOME
99.8/ 100
METRIC RATING
57th/ 347
METRIC RANK
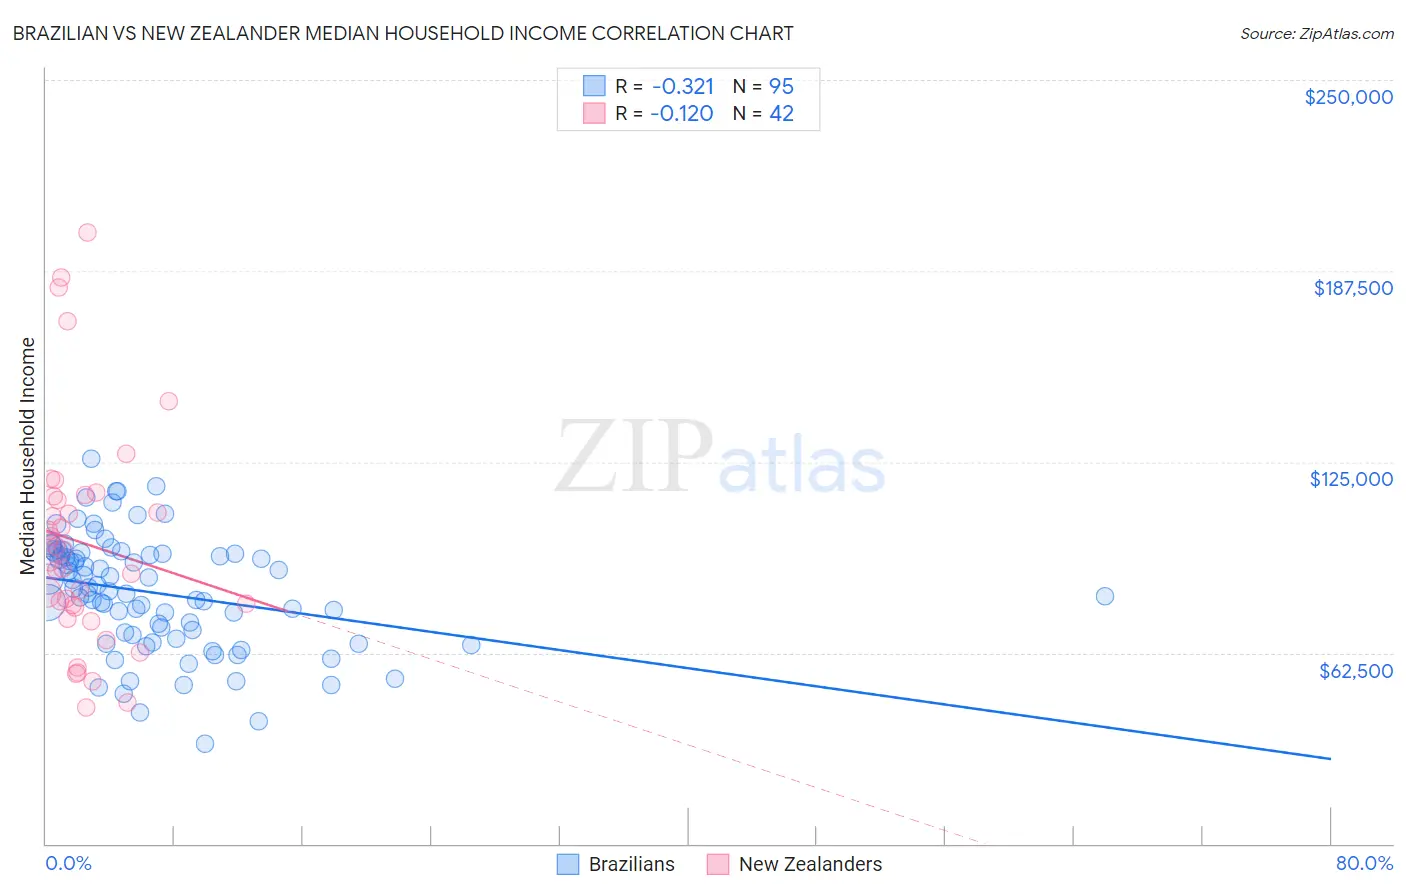
Brazilian vs New Zealander Median Household Income Correlation Chart
The statistical analysis conducted on geographies consisting of 323,646,187 people shows a mild negative correlation between the proportion of Brazilians and median household income in the United States with a correlation coefficient (R) of -0.321 and weighted average of $88,934. Similarly, the statistical analysis conducted on geographies consisting of 106,891,661 people shows a poor negative correlation between the proportion of New Zealanders and median household income in the United States with a correlation coefficient (R) of -0.120 and weighted average of $95,146, a difference of 7.0%.
Median Household Income Correlation Summary
| Measurement | Brazilian | New Zealander |
| Minimum | $32,591 | $44,447 |
| Maximum | $126,001 | $200,054 |
| Range | $93,410 | $155,607 |
| Mean | $82,158 | $98,486 |
| Median | $83,690 | $94,049 |
| Interquartile 25% (IQ1) | $68,333 | $77,381 |
| Interquartile 75% (IQ3) | $94,909 | $113,735 |
| Interquartile Range (IQR) | $26,576 | $36,354 |
| Standard Deviation (Sample) | $18,705 | $36,469 |
| Standard Deviation (Population) | $18,606 | $36,032 |
Similar Demographics by Median Household Income
Demographics Similar to Brazilians by Median Household Income
In terms of median household income, the demographic groups most similar to Brazilians are British ($88,914, a difference of 0.020%), Portuguese ($88,976, a difference of 0.050%), Immigrants from Peru ($89,010, a difference of 0.090%), Immigrants from Syria ($88,792, a difference of 0.16%), and Immigrants from Oceania ($89,100, a difference of 0.19%).
| Demographics | Rating | Rank | Median Household Income |
| Pakistanis | 94.8 /100 | #122 | Exceptional $89,638 |
| Immigrants | Zimbabwe | 94.4 /100 | #123 | Exceptional $89,496 |
| Immigrants | Jordan | 94.1 /100 | #124 | Exceptional $89,412 |
| Immigrants | Kuwait | 93.5 /100 | #125 | Exceptional $89,263 |
| Immigrants | Oceania | 92.9 /100 | #126 | Exceptional $89,100 |
| Immigrants | Peru | 92.5 /100 | #127 | Exceptional $89,010 |
| Portuguese | 92.3 /100 | #128 | Exceptional $88,976 |
| Brazilians | 92.1 /100 | #129 | Exceptional $88,934 |
| British | 92.0 /100 | #130 | Exceptional $88,914 |
| Immigrants | Syria | 91.4 /100 | #131 | Exceptional $88,792 |
| Europeans | 91.2 /100 | #132 | Exceptional $88,751 |
| Immigrants | Ethiopia | 90.9 /100 | #133 | Exceptional $88,687 |
| Swedes | 90.0 /100 | #134 | Exceptional $88,524 |
| Immigrants | Sierra Leone | 89.9 /100 | #135 | Excellent $88,498 |
| Poles | 89.7 /100 | #136 | Excellent $88,472 |
Demographics Similar to New Zealanders by Median Household Income
In terms of median household income, the demographic groups most similar to New Zealanders are Soviet Union ($95,098, a difference of 0.050%), Immigrants from Europe ($95,032, a difference of 0.12%), Korean ($95,018, a difference of 0.13%), Immigrants from Austria ($95,277, a difference of 0.14%), and Laotian ($94,990, a difference of 0.16%).
| Demographics | Rating | Rank | Median Household Income |
| Bulgarians | 99.9 /100 | #50 | Exceptional $96,290 |
| Estonians | 99.9 /100 | #51 | Exceptional $95,930 |
| Immigrants | South Africa | 99.9 /100 | #52 | Exceptional $95,800 |
| Paraguayans | 99.9 /100 | #53 | Exceptional $95,737 |
| Egyptians | 99.9 /100 | #54 | Exceptional $95,673 |
| Immigrants | Czechoslovakia | 99.9 /100 | #55 | Exceptional $95,319 |
| Immigrants | Austria | 99.9 /100 | #56 | Exceptional $95,277 |
| New Zealanders | 99.8 /100 | #57 | Exceptional $95,146 |
| Soviet Union | 99.8 /100 | #58 | Exceptional $95,098 |
| Immigrants | Europe | 99.8 /100 | #59 | Exceptional $95,032 |
| Koreans | 99.8 /100 | #60 | Exceptional $95,018 |
| Laotians | 99.8 /100 | #61 | Exceptional $94,990 |
| Immigrants | Norway | 99.8 /100 | #62 | Exceptional $94,846 |
| Greeks | 99.8 /100 | #63 | Exceptional $94,735 |
| Immigrants | Netherlands | 99.7 /100 | #64 | Exceptional $94,411 |