Cherokee vs Czechoslovakian Median Household Income
COMPARE
Cherokee
Czechoslovakian
Median Household Income
Median Household Income Comparison
Cherokee
Czechoslovakians
$72,682
MEDIAN HOUSEHOLD INCOME
0.0/ 100
METRIC RATING
301st/ 347
METRIC RANK
$84,965
MEDIAN HOUSEHOLD INCOME
47.8/ 100
METRIC RATING
178th/ 347
METRIC RANK
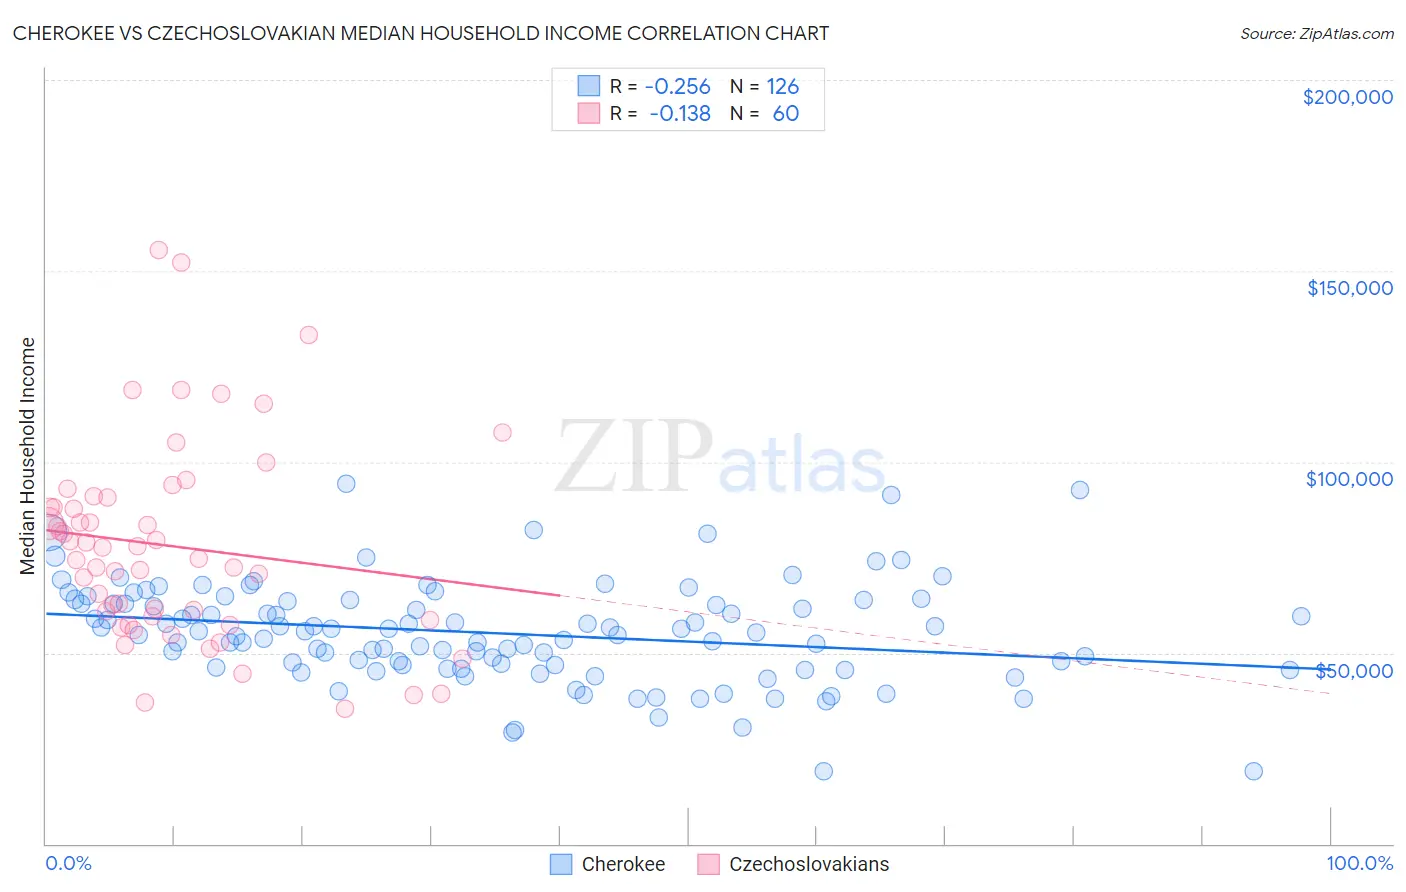
Cherokee vs Czechoslovakian Median Household Income Correlation Chart
The statistical analysis conducted on geographies consisting of 493,197,550 people shows a weak negative correlation between the proportion of Cherokee and median household income in the United States with a correlation coefficient (R) of -0.256 and weighted average of $72,682. Similarly, the statistical analysis conducted on geographies consisting of 368,473,547 people shows a poor negative correlation between the proportion of Czechoslovakians and median household income in the United States with a correlation coefficient (R) of -0.138 and weighted average of $84,965, a difference of 16.9%.
Median Household Income Correlation Summary
| Measurement | Cherokee | Czechoslovakian |
| Minimum | $18,882 | $35,250 |
| Maximum | $94,371 | $155,633 |
| Range | $75,489 | $120,383 |
| Mean | $55,165 | $77,955 |
| Median | $55,481 | $76,068 |
| Interquartile 25% (IQ1) | $46,693 | $59,148 |
| Interquartile 75% (IQ3) | $63,415 | $89,491 |
| Interquartile Range (IQR) | $16,722 | $30,343 |
| Standard Deviation (Sample) | $13,237 | $26,040 |
| Standard Deviation (Population) | $13,185 | $25,822 |
Similar Demographics by Median Household Income
Demographics Similar to Cherokee by Median Household Income
In terms of median household income, the demographic groups most similar to Cherokee are Shoshone ($72,660, a difference of 0.030%), African ($72,650, a difference of 0.040%), Immigrants from Dominica ($72,760, a difference of 0.11%), Immigrants from Haiti ($72,599, a difference of 0.11%), and Honduran ($72,588, a difference of 0.13%).
| Demographics | Rating | Rank | Median Household Income |
| Blackfeet | 0.1 /100 | #294 | Tragic $73,509 |
| Cubans | 0.1 /100 | #295 | Tragic $73,392 |
| Haitians | 0.1 /100 | #296 | Tragic $73,306 |
| Immigrants | Mexico | 0.0 /100 | #297 | Tragic $73,160 |
| Paiute | 0.0 /100 | #298 | Tragic $72,959 |
| Indonesians | 0.0 /100 | #299 | Tragic $72,856 |
| Immigrants | Dominica | 0.0 /100 | #300 | Tragic $72,760 |
| Cherokee | 0.0 /100 | #301 | Tragic $72,682 |
| Shoshone | 0.0 /100 | #302 | Tragic $72,660 |
| Africans | 0.0 /100 | #303 | Tragic $72,650 |
| Immigrants | Haiti | 0.0 /100 | #304 | Tragic $72,599 |
| Hondurans | 0.0 /100 | #305 | Tragic $72,588 |
| Potawatomi | 0.0 /100 | #306 | Tragic $72,576 |
| Ute | 0.0 /100 | #307 | Tragic $72,402 |
| Yakama | 0.0 /100 | #308 | Tragic $72,225 |
Demographics Similar to Czechoslovakians by Median Household Income
In terms of median household income, the demographic groups most similar to Czechoslovakians are English ($84,915, a difference of 0.060%), Immigrants from Eritrea ($85,025, a difference of 0.070%), Immigrants from Costa Rica ($85,054, a difference of 0.10%), Alsatian ($85,053, a difference of 0.10%), and Scottish ($85,101, a difference of 0.16%).
| Demographics | Rating | Rank | Median Household Income |
| Immigrants | South America | 58.1 /100 | #171 | Average $85,611 |
| Slovenes | 57.4 /100 | #172 | Average $85,562 |
| Immigrants | Cameroon | 53.4 /100 | #173 | Average $85,314 |
| Scottish | 50.0 /100 | #174 | Average $85,101 |
| Immigrants | Costa Rica | 49.2 /100 | #175 | Average $85,054 |
| Alsatians | 49.2 /100 | #176 | Average $85,053 |
| Immigrants | Eritrea | 48.8 /100 | #177 | Average $85,025 |
| Czechoslovakians | 47.8 /100 | #178 | Average $84,965 |
| English | 47.0 /100 | #179 | Average $84,915 |
| Immigrants | Portugal | 44.2 /100 | #180 | Average $84,740 |
| Hawaiians | 44.1 /100 | #181 | Average $84,729 |
| Uruguayans | 43.5 /100 | #182 | Average $84,691 |
| Spaniards | 42.7 /100 | #183 | Average $84,644 |
| Immigrants | Eastern Africa | 37.4 /100 | #184 | Fair $84,299 |
| Kenyans | 34.2 /100 | #185 | Fair $84,085 |