Cherokee vs Shoshone Median Household Income
COMPARE
Cherokee
Shoshone
Median Household Income
Median Household Income Comparison
Cherokee
Shoshone
$72,682
MEDIAN HOUSEHOLD INCOME
0.0/ 100
METRIC RATING
301st/ 347
METRIC RANK
$72,660
MEDIAN HOUSEHOLD INCOME
0.0/ 100
METRIC RATING
302nd/ 347
METRIC RANK
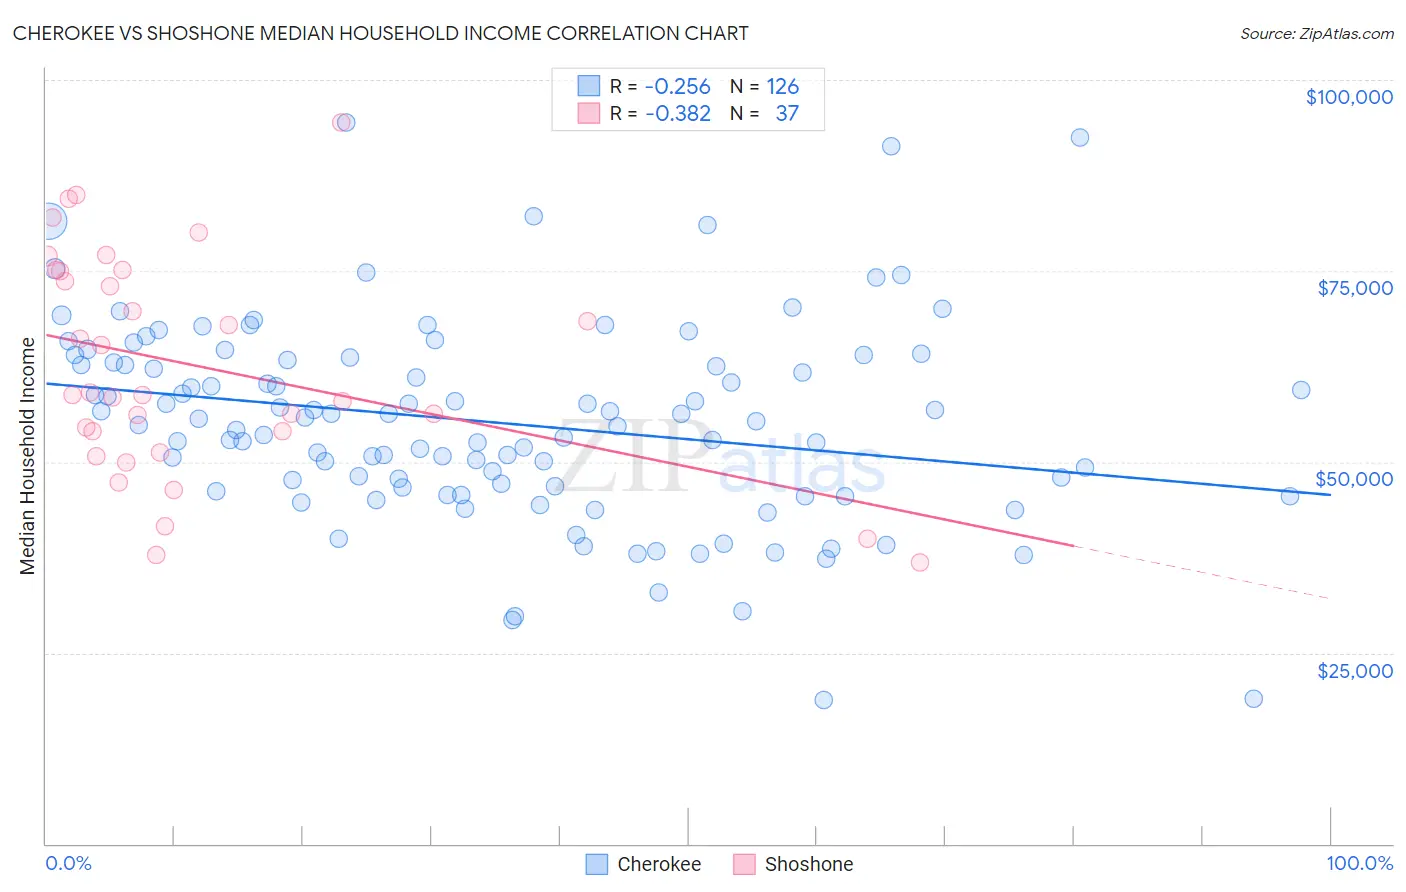
Cherokee vs Shoshone Median Household Income Correlation Chart
The statistical analysis conducted on geographies consisting of 493,197,550 people shows a weak negative correlation between the proportion of Cherokee and median household income in the United States with a correlation coefficient (R) of -0.256 and weighted average of $72,682. Similarly, the statistical analysis conducted on geographies consisting of 66,612,449 people shows a mild negative correlation between the proportion of Shoshone and median household income in the United States with a correlation coefficient (R) of -0.382 and weighted average of $72,660, a difference of 0.030%.
Median Household Income Correlation Summary
| Measurement | Cherokee | Shoshone |
| Minimum | $18,882 | $36,823 |
| Maximum | $94,371 | $94,375 |
| Range | $75,489 | $57,552 |
| Mean | $55,165 | $62,559 |
| Median | $55,481 | $58,750 |
| Interquartile 25% (IQ1) | $46,693 | $52,629 |
| Interquartile 75% (IQ3) | $63,415 | $75,002 |
| Interquartile Range (IQR) | $16,722 | $22,372 |
| Standard Deviation (Sample) | $13,237 | $14,416 |
| Standard Deviation (Population) | $13,185 | $14,219 |
Demographics Similar to Cherokee and Shoshone by Median Household Income
In terms of median household income, the demographic groups most similar to Cherokee are African ($72,650, a difference of 0.040%), Immigrants from Dominica ($72,760, a difference of 0.11%), Immigrants from Haiti ($72,599, a difference of 0.11%), Honduran ($72,588, a difference of 0.13%), and Potawatomi ($72,576, a difference of 0.15%). Similarly, the demographic groups most similar to Shoshone are African ($72,650, a difference of 0.010%), Immigrants from Haiti ($72,599, a difference of 0.080%), Honduran ($72,588, a difference of 0.10%), Potawatomi ($72,576, a difference of 0.12%), and Immigrants from Dominica ($72,760, a difference of 0.14%).
| Demographics | Rating | Rank | Median Household Income |
| Hispanics or Latinos | 0.1 /100 | #291 | Tragic $73,823 |
| Comanche | 0.1 /100 | #292 | Tragic $73,747 |
| Immigrants | Cabo Verde | 0.1 /100 | #293 | Tragic $73,515 |
| Blackfeet | 0.1 /100 | #294 | Tragic $73,509 |
| Cubans | 0.1 /100 | #295 | Tragic $73,392 |
| Haitians | 0.1 /100 | #296 | Tragic $73,306 |
| Immigrants | Mexico | 0.0 /100 | #297 | Tragic $73,160 |
| Paiute | 0.0 /100 | #298 | Tragic $72,959 |
| Indonesians | 0.0 /100 | #299 | Tragic $72,856 |
| Immigrants | Dominica | 0.0 /100 | #300 | Tragic $72,760 |
| Cherokee | 0.0 /100 | #301 | Tragic $72,682 |
| Shoshone | 0.0 /100 | #302 | Tragic $72,660 |
| Africans | 0.0 /100 | #303 | Tragic $72,650 |
| Immigrants | Haiti | 0.0 /100 | #304 | Tragic $72,599 |
| Hondurans | 0.0 /100 | #305 | Tragic $72,588 |
| Potawatomi | 0.0 /100 | #306 | Tragic $72,576 |
| Ute | 0.0 /100 | #307 | Tragic $72,402 |
| Yakama | 0.0 /100 | #308 | Tragic $72,225 |
| Immigrants | Caribbean | 0.0 /100 | #309 | Tragic $71,860 |
| U.S. Virgin Islanders | 0.0 /100 | #310 | Tragic $71,853 |
| Immigrants | Zaire | 0.0 /100 | #311 | Tragic $71,801 |