Cherokee vs Black/African American Median Household Income
COMPARE
Cherokee
Black/African American
Median Household Income
Median Household Income Comparison
Cherokee
Blacks/African Americans
$72,682
MEDIAN HOUSEHOLD INCOME
0.0/ 100
METRIC RATING
301st/ 347
METRIC RANK
$67,573
MEDIAN HOUSEHOLD INCOME
0.0/ 100
METRIC RATING
334th/ 347
METRIC RANK
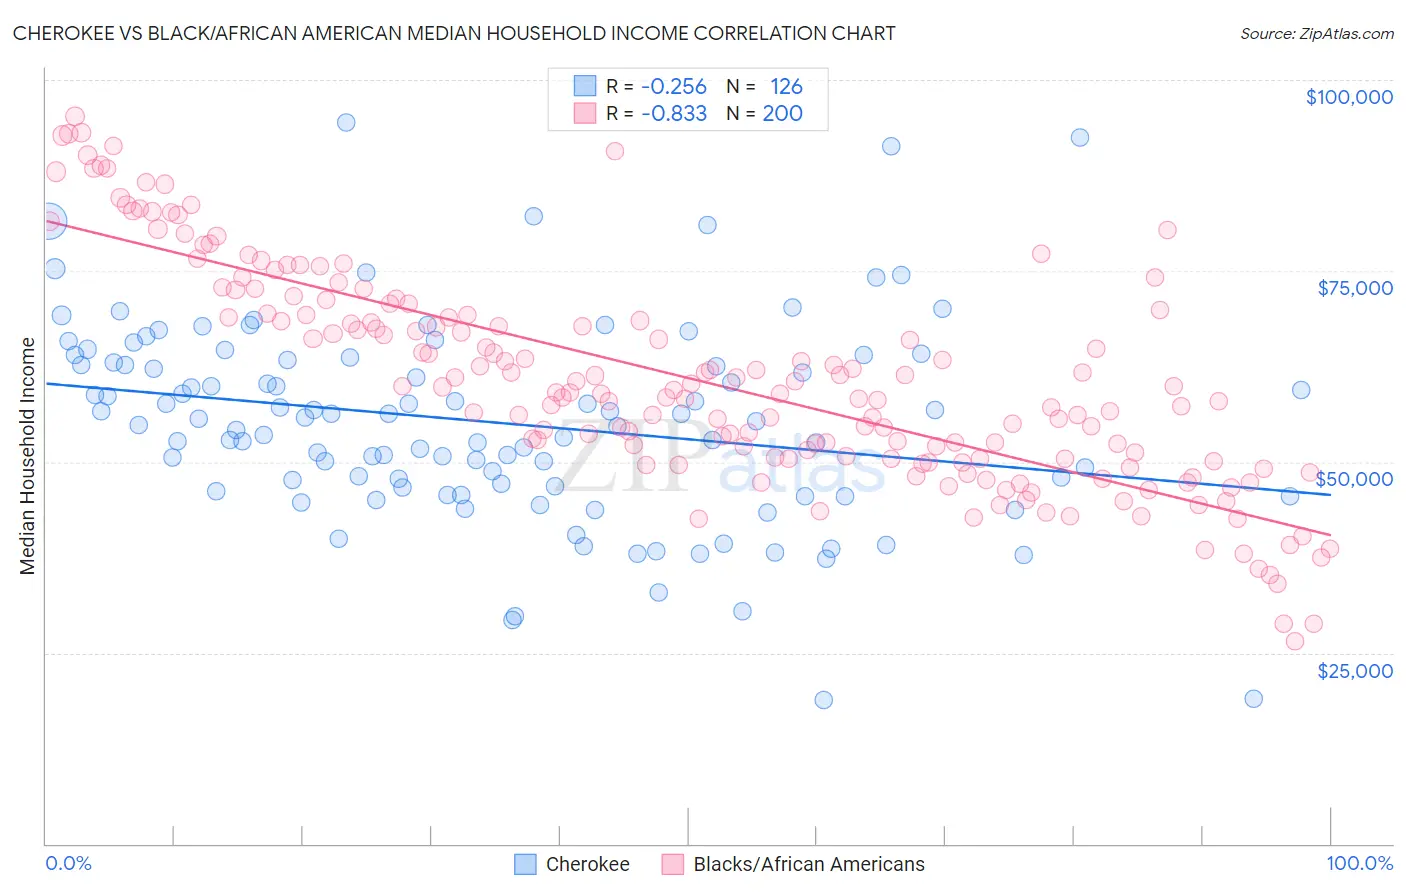
Cherokee vs Black/African American Median Household Income Correlation Chart
The statistical analysis conducted on geographies consisting of 493,197,550 people shows a weak negative correlation between the proportion of Cherokee and median household income in the United States with a correlation coefficient (R) of -0.256 and weighted average of $72,682. Similarly, the statistical analysis conducted on geographies consisting of 564,831,998 people shows a very strong negative correlation between the proportion of Blacks/African Americans and median household income in the United States with a correlation coefficient (R) of -0.833 and weighted average of $67,573, a difference of 7.6%.
Median Household Income Correlation Summary
| Measurement | Cherokee | Black/African American |
| Minimum | $18,882 | $26,476 |
| Maximum | $94,371 | $95,304 |
| Range | $75,489 | $68,828 |
| Mean | $55,165 | $60,966 |
| Median | $55,481 | $59,295 |
| Interquartile 25% (IQ1) | $46,693 | $50,395 |
| Interquartile 75% (IQ3) | $63,415 | $69,686 |
| Interquartile Range (IQR) | $16,722 | $19,291 |
| Standard Deviation (Sample) | $13,237 | $14,297 |
| Standard Deviation (Population) | $13,185 | $14,261 |
Similar Demographics by Median Household Income
Demographics Similar to Cherokee by Median Household Income
In terms of median household income, the demographic groups most similar to Cherokee are Shoshone ($72,660, a difference of 0.030%), African ($72,650, a difference of 0.040%), Immigrants from Dominica ($72,760, a difference of 0.11%), Immigrants from Haiti ($72,599, a difference of 0.11%), and Honduran ($72,588, a difference of 0.13%).
| Demographics | Rating | Rank | Median Household Income |
| Blackfeet | 0.1 /100 | #294 | Tragic $73,509 |
| Cubans | 0.1 /100 | #295 | Tragic $73,392 |
| Haitians | 0.1 /100 | #296 | Tragic $73,306 |
| Immigrants | Mexico | 0.0 /100 | #297 | Tragic $73,160 |
| Paiute | 0.0 /100 | #298 | Tragic $72,959 |
| Indonesians | 0.0 /100 | #299 | Tragic $72,856 |
| Immigrants | Dominica | 0.0 /100 | #300 | Tragic $72,760 |
| Cherokee | 0.0 /100 | #301 | Tragic $72,682 |
| Shoshone | 0.0 /100 | #302 | Tragic $72,660 |
| Africans | 0.0 /100 | #303 | Tragic $72,650 |
| Immigrants | Haiti | 0.0 /100 | #304 | Tragic $72,599 |
| Hondurans | 0.0 /100 | #305 | Tragic $72,588 |
| Potawatomi | 0.0 /100 | #306 | Tragic $72,576 |
| Ute | 0.0 /100 | #307 | Tragic $72,402 |
| Yakama | 0.0 /100 | #308 | Tragic $72,225 |
Demographics Similar to Blacks/African Americans by Median Household Income
In terms of median household income, the demographic groups most similar to Blacks/African Americans are Creek ($67,715, a difference of 0.21%), Sioux ($67,792, a difference of 0.32%), Native/Alaskan ($67,879, a difference of 0.45%), Arapaho ($67,965, a difference of 0.58%), and Cheyenne ($66,974, a difference of 0.89%).
| Demographics | Rating | Rank | Median Household Income |
| Immigrants | Cuba | 0.0 /100 | #327 | Tragic $68,461 |
| Menominee | 0.0 /100 | #328 | Tragic $68,423 |
| Dutch West Indians | 0.0 /100 | #329 | Tragic $68,412 |
| Arapaho | 0.0 /100 | #330 | Tragic $67,965 |
| Natives/Alaskans | 0.0 /100 | #331 | Tragic $67,879 |
| Sioux | 0.0 /100 | #332 | Tragic $67,792 |
| Creek | 0.0 /100 | #333 | Tragic $67,715 |
| Blacks/African Americans | 0.0 /100 | #334 | Tragic $67,573 |
| Cheyenne | 0.0 /100 | #335 | Tragic $66,974 |
| Immigrants | Congo | 0.0 /100 | #336 | Tragic $66,768 |
| Kiowa | 0.0 /100 | #337 | Tragic $65,914 |
| Immigrants | Yemen | 0.0 /100 | #338 | Tragic $65,194 |
| Hopi | 0.0 /100 | #339 | Tragic $65,043 |
| Pueblo | 0.0 /100 | #340 | Tragic $64,692 |
| Crow | 0.0 /100 | #341 | Tragic $63,681 |