Cherokee vs Pennsylvania German Median Household Income
COMPARE
Cherokee
Pennsylvania German
Median Household Income
Median Household Income Comparison
Cherokee
Pennsylvania Germans
$72,682
MEDIAN HOUSEHOLD INCOME
0.0/ 100
METRIC RATING
301st/ 347
METRIC RANK
$75,814
MEDIAN HOUSEHOLD INCOME
0.3/ 100
METRIC RATING
271st/ 347
METRIC RANK
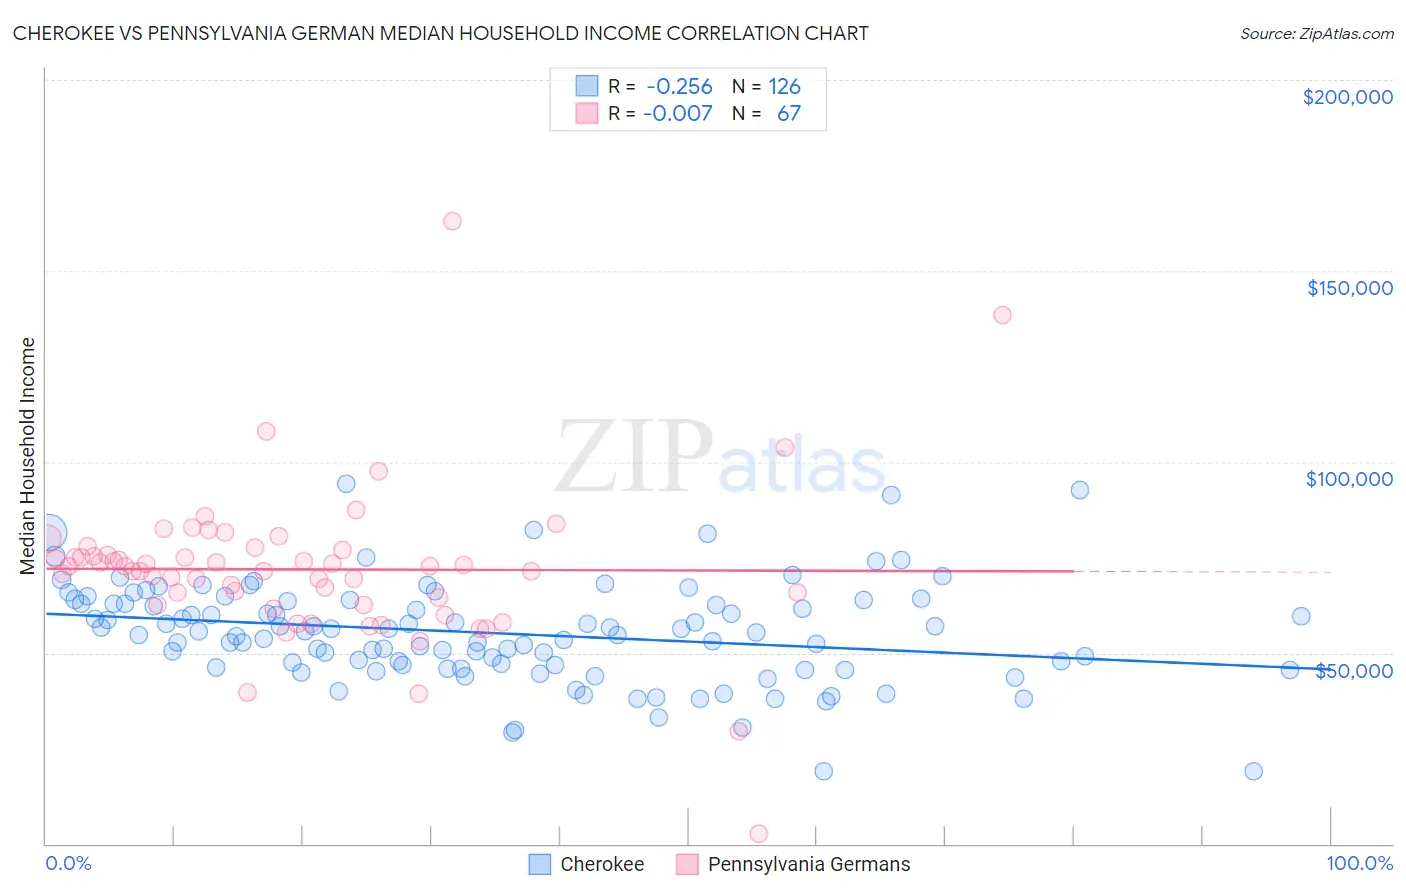
Cherokee vs Pennsylvania German Median Household Income Correlation Chart
The statistical analysis conducted on geographies consisting of 493,197,550 people shows a weak negative correlation between the proportion of Cherokee and median household income in the United States with a correlation coefficient (R) of -0.256 and weighted average of $72,682. Similarly, the statistical analysis conducted on geographies consisting of 234,029,688 people shows no correlation between the proportion of Pennsylvania Germans and median household income in the United States with a correlation coefficient (R) of -0.007 and weighted average of $75,814, a difference of 4.3%.
Median Household Income Correlation Summary
| Measurement | Cherokee | Pennsylvania German |
| Minimum | $18,882 | $2,499 |
| Maximum | $94,371 | $162,917 |
| Range | $75,489 | $160,418 |
| Mean | $55,165 | $71,846 |
| Median | $55,481 | $72,559 |
| Interquartile 25% (IQ1) | $46,693 | $62,513 |
| Interquartile 75% (IQ3) | $63,415 | $76,865 |
| Interquartile Range (IQR) | $16,722 | $14,352 |
| Standard Deviation (Sample) | $13,237 | $20,812 |
| Standard Deviation (Population) | $13,185 | $20,656 |
Similar Demographics by Median Household Income
Demographics Similar to Cherokee by Median Household Income
In terms of median household income, the demographic groups most similar to Cherokee are Shoshone ($72,660, a difference of 0.030%), African ($72,650, a difference of 0.040%), Immigrants from Dominica ($72,760, a difference of 0.11%), Immigrants from Haiti ($72,599, a difference of 0.11%), and Honduran ($72,588, a difference of 0.13%).
| Demographics | Rating | Rank | Median Household Income |
| Blackfeet | 0.1 /100 | #294 | Tragic $73,509 |
| Cubans | 0.1 /100 | #295 | Tragic $73,392 |
| Haitians | 0.1 /100 | #296 | Tragic $73,306 |
| Immigrants | Mexico | 0.0 /100 | #297 | Tragic $73,160 |
| Paiute | 0.0 /100 | #298 | Tragic $72,959 |
| Indonesians | 0.0 /100 | #299 | Tragic $72,856 |
| Immigrants | Dominica | 0.0 /100 | #300 | Tragic $72,760 |
| Cherokee | 0.0 /100 | #301 | Tragic $72,682 |
| Shoshone | 0.0 /100 | #302 | Tragic $72,660 |
| Africans | 0.0 /100 | #303 | Tragic $72,650 |
| Immigrants | Haiti | 0.0 /100 | #304 | Tragic $72,599 |
| Hondurans | 0.0 /100 | #305 | Tragic $72,588 |
| Potawatomi | 0.0 /100 | #306 | Tragic $72,576 |
| Ute | 0.0 /100 | #307 | Tragic $72,402 |
| Yakama | 0.0 /100 | #308 | Tragic $72,225 |
Demographics Similar to Pennsylvania Germans by Median Household Income
In terms of median household income, the demographic groups most similar to Pennsylvania Germans are Hmong ($75,839, a difference of 0.030%), Somali ($75,782, a difference of 0.040%), Immigrants from Jamaica ($75,851, a difference of 0.050%), Cape Verdean ($75,848, a difference of 0.050%), and German Russian ($75,856, a difference of 0.060%).
| Demographics | Rating | Rank | Median Household Income |
| Guatemalans | 0.3 /100 | #264 | Tragic $75,961 |
| Immigrants | Belize | 0.3 /100 | #265 | Tragic $75,938 |
| Americans | 0.3 /100 | #266 | Tragic $75,932 |
| German Russians | 0.3 /100 | #267 | Tragic $75,856 |
| Immigrants | Jamaica | 0.3 /100 | #268 | Tragic $75,851 |
| Cape Verdeans | 0.3 /100 | #269 | Tragic $75,848 |
| Hmong | 0.3 /100 | #270 | Tragic $75,839 |
| Pennsylvania Germans | 0.3 /100 | #271 | Tragic $75,814 |
| Somalis | 0.3 /100 | #272 | Tragic $75,782 |
| Liberians | 0.2 /100 | #273 | Tragic $75,667 |
| British West Indians | 0.2 /100 | #274 | Tragic $75,647 |
| Immigrants | Micronesia | 0.2 /100 | #275 | Tragic $75,574 |
| Immigrants | Latin America | 0.2 /100 | #276 | Tragic $75,420 |
| Spanish Americans | 0.2 /100 | #277 | Tragic $75,386 |
| Osage | 0.2 /100 | #278 | Tragic $75,240 |