Celtic vs Immigrants from El Salvador Median Family Income
COMPARE
Celtic
Immigrants from El Salvador
Median Family Income
Median Family Income Comparison
Celtics
Immigrants from El Salvador
$101,139
MEDIAN FAMILY INCOME
31.3/ 100
METRIC RATING
186th/ 347
METRIC RANK
$92,545
MEDIAN FAMILY INCOME
0.6/ 100
METRIC RATING
252nd/ 347
METRIC RANK
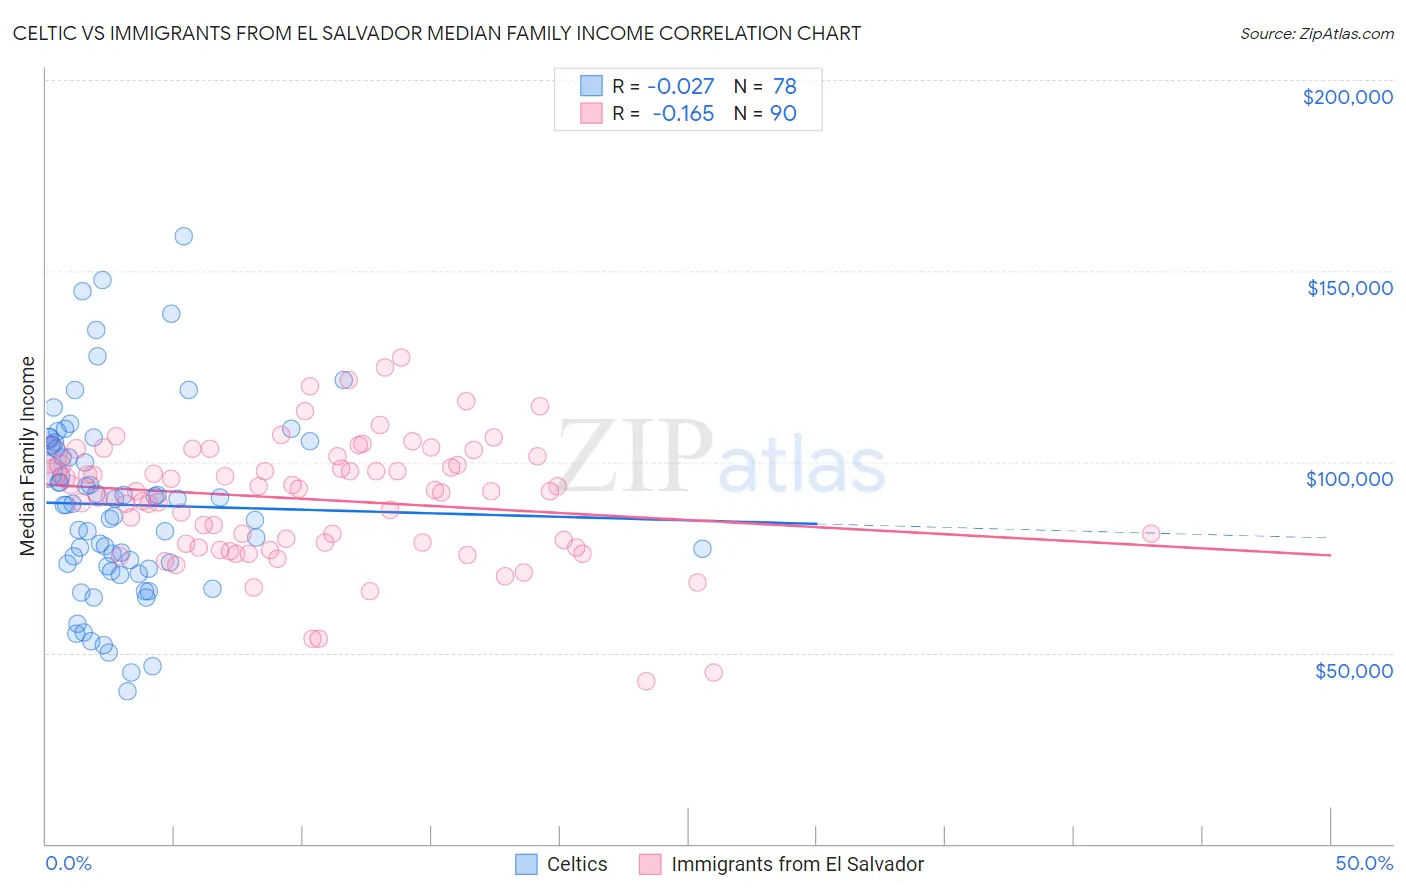
Celtic vs Immigrants from El Salvador Median Family Income Correlation Chart
The statistical analysis conducted on geographies consisting of 168,835,112 people shows no correlation between the proportion of Celtics and median family income in the United States with a correlation coefficient (R) of -0.027 and weighted average of $101,139. Similarly, the statistical analysis conducted on geographies consisting of 357,645,519 people shows a poor negative correlation between the proportion of Immigrants from El Salvador and median family income in the United States with a correlation coefficient (R) of -0.165 and weighted average of $92,545, a difference of 9.3%.
Median Family Income Correlation Summary
| Measurement | Celtic | Immigrants from El Salvador |
| Minimum | $39,850 | $42,420 |
| Maximum | $159,107 | $127,446 |
| Range | $119,257 | $85,026 |
| Mean | $88,779 | $90,153 |
| Median | $88,800 | $92,338 |
| Interquartile 25% (IQ1) | $72,704 | $78,680 |
| Interquartile 75% (IQ3) | $104,459 | $101,462 |
| Interquartile Range (IQR) | $31,755 | $22,782 |
| Standard Deviation (Sample) | $24,372 | $16,234 |
| Standard Deviation (Population) | $24,216 | $16,143 |
Similar Demographics by Median Family Income
Demographics Similar to Celtics by Median Family Income
In terms of median family income, the demographic groups most similar to Celtics are Dutch ($101,192, a difference of 0.050%), Tlingit-Haida ($101,092, a difference of 0.050%), Guamanian/Chamorro ($101,061, a difference of 0.080%), Immigrants from Portugal ($100,984, a difference of 0.15%), and Immigrants ($100,962, a difference of 0.18%).
| Demographics | Rating | Rank | Median Family Income |
| South Americans | 39.7 /100 | #179 | Fair $101,856 |
| French Canadians | 37.0 /100 | #180 | Fair $101,634 |
| Spaniards | 36.8 /100 | #181 | Fair $101,617 |
| Tsimshian | 35.9 /100 | #182 | Fair $101,543 |
| Kenyans | 34.5 /100 | #183 | Fair $101,417 |
| Immigrants | Costa Rica | 33.7 /100 | #184 | Fair $101,354 |
| Dutch | 31.9 /100 | #185 | Fair $101,192 |
| Celtics | 31.3 /100 | #186 | Fair $101,139 |
| Tlingit-Haida | 30.8 /100 | #187 | Fair $101,092 |
| Guamanians/Chamorros | 30.5 /100 | #188 | Fair $101,061 |
| Immigrants | Portugal | 29.6 /100 | #189 | Fair $100,984 |
| Immigrants | Immigrants | 29.4 /100 | #190 | Fair $100,962 |
| Colombians | 27.2 /100 | #191 | Fair $100,750 |
| Immigrants | Kenya | 26.5 /100 | #192 | Fair $100,679 |
| Iraqis | 26.3 /100 | #193 | Fair $100,658 |
Demographics Similar to Immigrants from El Salvador by Median Family Income
In terms of median family income, the demographic groups most similar to Immigrants from El Salvador are Immigrants from Guyana ($92,513, a difference of 0.030%), Immigrants from Somalia ($92,609, a difference of 0.070%), Immigrants from Barbados ($92,419, a difference of 0.14%), West Indian ($92,765, a difference of 0.24%), and Immigrants from Ecuador ($92,837, a difference of 0.32%).
| Demographics | Rating | Rank | Median Family Income |
| Immigrants | Middle Africa | 1.0 /100 | #245 | Tragic $93,593 |
| Guyanese | 0.9 /100 | #246 | Tragic $93,373 |
| Immigrants | Senegal | 0.7 /100 | #247 | Tragic $92,912 |
| French American Indians | 0.7 /100 | #248 | Tragic $92,872 |
| Immigrants | Ecuador | 0.7 /100 | #249 | Tragic $92,837 |
| West Indians | 0.6 /100 | #250 | Tragic $92,765 |
| Immigrants | Somalia | 0.6 /100 | #251 | Tragic $92,609 |
| Immigrants | El Salvador | 0.6 /100 | #252 | Tragic $92,545 |
| Immigrants | Guyana | 0.6 /100 | #253 | Tragic $92,513 |
| Immigrants | Barbados | 0.5 /100 | #254 | Tragic $92,419 |
| Immigrants | Laos | 0.5 /100 | #255 | Tragic $92,239 |
| Nicaraguans | 0.5 /100 | #256 | Tragic $92,231 |
| Americans | 0.4 /100 | #257 | Tragic $92,096 |
| Osage | 0.4 /100 | #258 | Tragic $91,926 |
| Cape Verdeans | 0.4 /100 | #259 | Tragic $91,848 |