Immigrants from Western Africa vs Immigrants from Central America Median Family Income
COMPARE
Immigrants from Western Africa
Immigrants from Central America
Median Family Income
Median Family Income Comparison
Immigrants from Western Africa
Immigrants from Central America
$94,638
MEDIAN FAMILY INCOME
1.6/ 100
METRIC RATING
234th/ 347
METRIC RANK
$85,050
MEDIAN FAMILY INCOME
0.0/ 100
METRIC RATING
310th/ 347
METRIC RANK
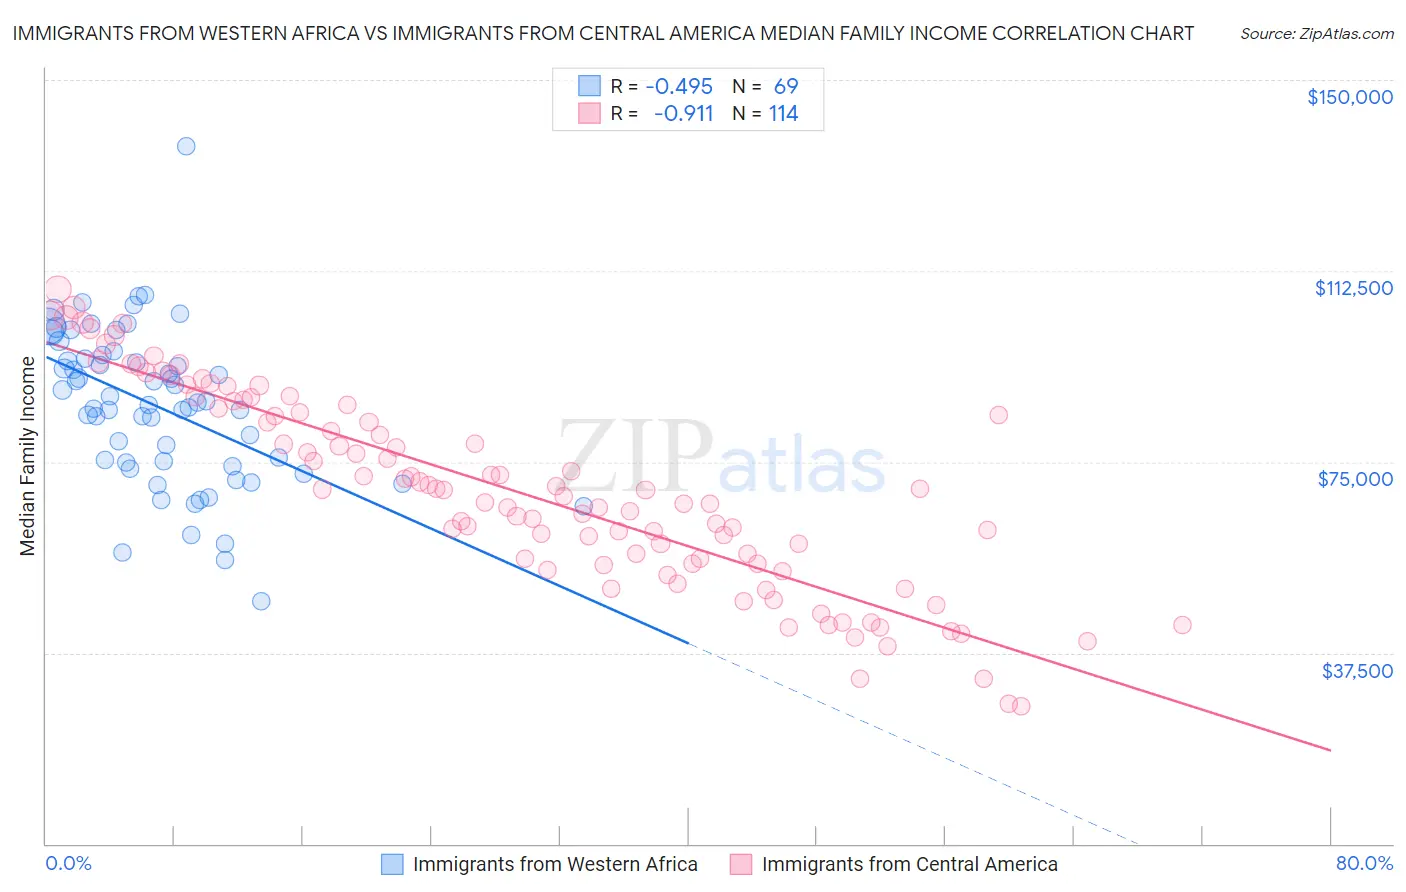
Immigrants from Western Africa vs Immigrants from Central America Median Family Income Correlation Chart
The statistical analysis conducted on geographies consisting of 357,410,586 people shows a moderate negative correlation between the proportion of Immigrants from Western Africa and median family income in the United States with a correlation coefficient (R) of -0.495 and weighted average of $94,638. Similarly, the statistical analysis conducted on geographies consisting of 535,546,220 people shows a near-perfect negative correlation between the proportion of Immigrants from Central America and median family income in the United States with a correlation coefficient (R) of -0.911 and weighted average of $85,050, a difference of 11.3%.
Median Family Income Correlation Summary
| Measurement | Immigrants from Western Africa | Immigrants from Central America |
| Minimum | $47,599 | $27,125 |
| Maximum | $136,923 | $108,930 |
| Range | $89,324 | $81,805 |
| Mean | $85,944 | $69,313 |
| Median | $86,589 | $69,476 |
| Interquartile 25% (IQ1) | $74,581 | $55,080 |
| Interquartile 75% (IQ3) | $95,623 | $85,500 |
| Interquartile Range (IQR) | $21,043 | $30,420 |
| Standard Deviation (Sample) | $15,373 | $19,367 |
| Standard Deviation (Population) | $15,261 | $19,282 |
Similar Demographics by Median Family Income
Demographics Similar to Immigrants from Western Africa by Median Family Income
In terms of median family income, the demographic groups most similar to Immigrants from Western Africa are Immigrants from Bangladesh ($94,665, a difference of 0.030%), Immigrants from Burma/Myanmar ($94,472, a difference of 0.18%), Trinidadian and Tobagonian ($94,466, a difference of 0.18%), Alaskan Athabascan ($94,429, a difference of 0.22%), and Immigrants from Venezuela ($94,904, a difference of 0.28%).
| Demographics | Rating | Rank | Median Family Income |
| Alaska Natives | 2.6 /100 | #227 | Tragic $95,573 |
| Immigrants | Azores | 2.4 /100 | #228 | Tragic $95,402 |
| Marshallese | 2.2 /100 | #229 | Tragic $95,293 |
| Malaysians | 2.2 /100 | #230 | Tragic $95,230 |
| Ecuadorians | 2.1 /100 | #231 | Tragic $95,114 |
| Immigrants | Venezuela | 1.9 /100 | #232 | Tragic $94,904 |
| Immigrants | Bangladesh | 1.6 /100 | #233 | Tragic $94,665 |
| Immigrants | Western Africa | 1.6 /100 | #234 | Tragic $94,638 |
| Immigrants | Burma/Myanmar | 1.5 /100 | #235 | Tragic $94,472 |
| Trinidadians and Tobagonians | 1.5 /100 | #236 | Tragic $94,466 |
| Alaskan Athabascans | 1.5 /100 | #237 | Tragic $94,429 |
| Nepalese | 1.3 /100 | #238 | Tragic $94,153 |
| Salvadorans | 1.2 /100 | #239 | Tragic $94,109 |
| Somalis | 1.2 /100 | #240 | Tragic $94,085 |
| Immigrants | Trinidad and Tobago | 1.2 /100 | #241 | Tragic $93,988 |
Demographics Similar to Immigrants from Central America by Median Family Income
In terms of median family income, the demographic groups most similar to Immigrants from Central America are Honduran ($85,004, a difference of 0.050%), Cuban ($84,981, a difference of 0.080%), Haitian ($85,218, a difference of 0.20%), Choctaw ($84,835, a difference of 0.25%), and U.S. Virgin Islander ($85,294, a difference of 0.29%).
| Demographics | Rating | Rank | Median Family Income |
| Hispanics or Latinos | 0.0 /100 | #303 | Tragic $85,647 |
| Mexicans | 0.0 /100 | #304 | Tragic $85,618 |
| Paiute | 0.0 /100 | #305 | Tragic $85,414 |
| Immigrants | Dominica | 0.0 /100 | #306 | Tragic $85,411 |
| Chickasaw | 0.0 /100 | #307 | Tragic $85,356 |
| U.S. Virgin Islanders | 0.0 /100 | #308 | Tragic $85,294 |
| Haitians | 0.0 /100 | #309 | Tragic $85,218 |
| Immigrants | Central America | 0.0 /100 | #310 | Tragic $85,050 |
| Hondurans | 0.0 /100 | #311 | Tragic $85,004 |
| Cubans | 0.0 /100 | #312 | Tragic $84,981 |
| Choctaw | 0.0 /100 | #313 | Tragic $84,835 |
| Immigrants | Bahamas | 0.0 /100 | #314 | Tragic $84,732 |
| Apache | 0.0 /100 | #315 | Tragic $84,451 |
| Immigrants | Haiti | 0.0 /100 | #316 | Tragic $84,018 |
| Yakama | 0.0 /100 | #317 | Tragic $83,932 |