Immigrants from Armenia vs Immigrants from Central America Median Family Income
COMPARE
Immigrants from Armenia
Immigrants from Central America
Median Family Income
Median Family Income Comparison
Immigrants from Armenia
Immigrants from Central America
$97,605
MEDIAN FAMILY INCOME
7.0/ 100
METRIC RATING
213th/ 347
METRIC RANK
$85,050
MEDIAN FAMILY INCOME
0.0/ 100
METRIC RATING
310th/ 347
METRIC RANK
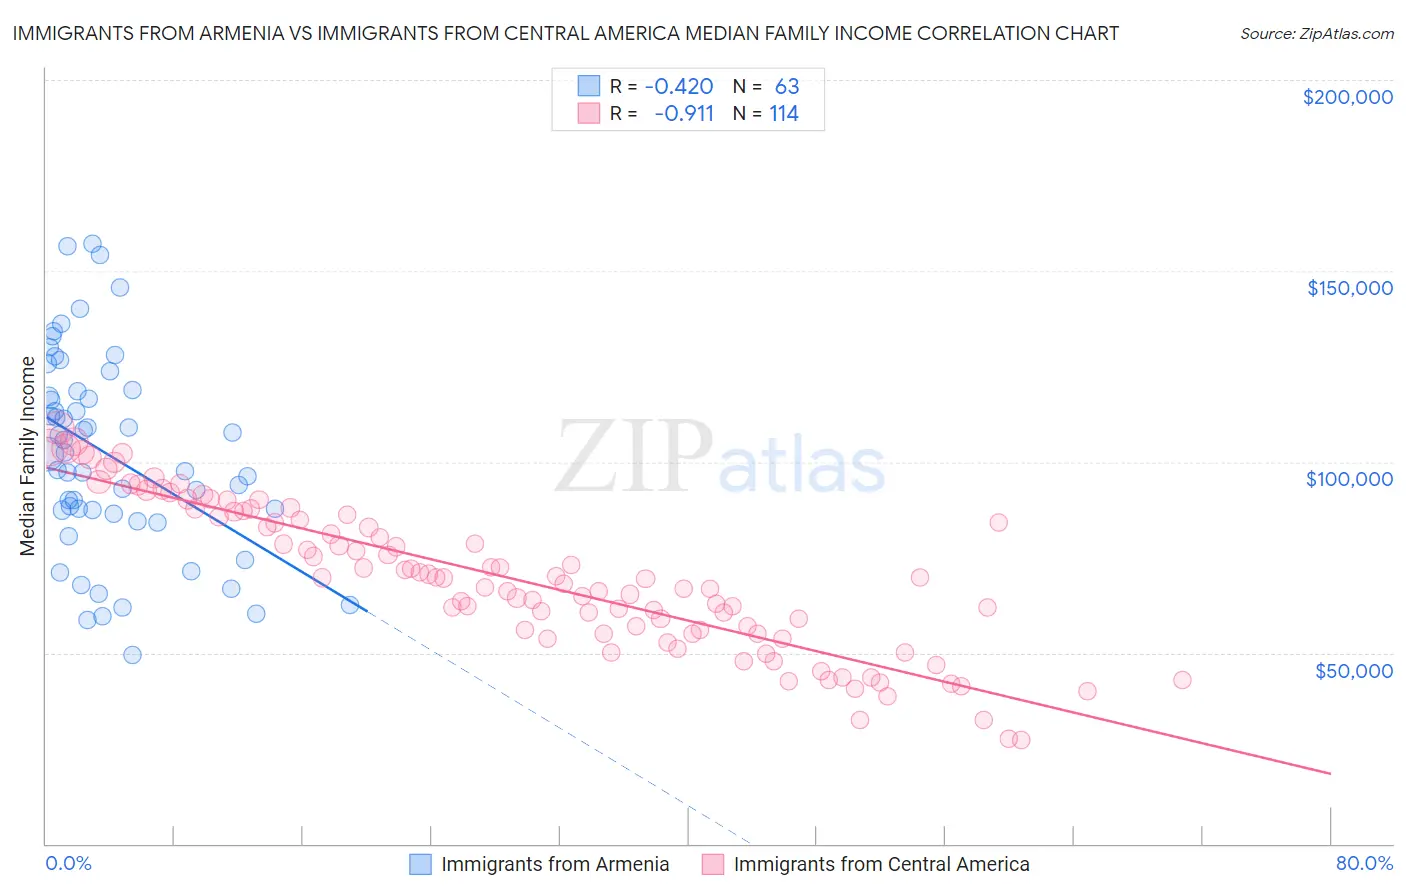
Immigrants from Armenia vs Immigrants from Central America Median Family Income Correlation Chart
The statistical analysis conducted on geographies consisting of 97,713,870 people shows a moderate negative correlation between the proportion of Immigrants from Armenia and median family income in the United States with a correlation coefficient (R) of -0.420 and weighted average of $97,605. Similarly, the statistical analysis conducted on geographies consisting of 535,546,220 people shows a near-perfect negative correlation between the proportion of Immigrants from Central America and median family income in the United States with a correlation coefficient (R) of -0.911 and weighted average of $85,050, a difference of 14.8%.
Median Family Income Correlation Summary
| Measurement | Immigrants from Armenia | Immigrants from Central America |
| Minimum | $49,583 | $27,125 |
| Maximum | $157,199 | $108,930 |
| Range | $107,616 | $81,805 |
| Mean | $101,713 | $69,313 |
| Median | $102,061 | $69,476 |
| Interquartile 25% (IQ1) | $86,292 | $55,080 |
| Interquartile 75% (IQ3) | $118,550 | $85,500 |
| Interquartile Range (IQR) | $32,258 | $30,420 |
| Standard Deviation (Sample) | $25,932 | $19,367 |
| Standard Deviation (Population) | $25,725 | $19,282 |
Similar Demographics by Median Family Income
Demographics Similar to Immigrants from Armenia by Median Family Income
In terms of median family income, the demographic groups most similar to Immigrants from Armenia are Bermudan ($97,577, a difference of 0.030%), Panamanian ($97,683, a difference of 0.080%), Nigerian ($97,522, a difference of 0.090%), Immigrants from Sudan ($97,737, a difference of 0.13%), and Immigrants from Bosnia and Herzegovina ($97,432, a difference of 0.18%).
| Demographics | Rating | Rank | Median Family Income |
| Immigrants | Iraq | 12.1 /100 | #206 | Poor $98,786 |
| Aleuts | 11.6 /100 | #207 | Poor $98,702 |
| Immigrants | Uruguay | 9.2 /100 | #208 | Tragic $98,205 |
| Immigrants | Colombia | 8.7 /100 | #209 | Tragic $98,067 |
| Puget Sound Salish | 8.2 /100 | #210 | Tragic $97,958 |
| Immigrants | Sudan | 7.4 /100 | #211 | Tragic $97,737 |
| Panamanians | 7.2 /100 | #212 | Tragic $97,683 |
| Immigrants | Armenia | 7.0 /100 | #213 | Tragic $97,605 |
| Bermudans | 6.9 /100 | #214 | Tragic $97,577 |
| Nigerians | 6.7 /100 | #215 | Tragic $97,522 |
| Immigrants | Bosnia and Herzegovina | 6.4 /100 | #216 | Tragic $97,432 |
| Japanese | 6.0 /100 | #217 | Tragic $97,288 |
| Immigrants | Cambodia | 5.8 /100 | #218 | Tragic $97,222 |
| Delaware | 5.1 /100 | #219 | Tragic $96,958 |
| Sudanese | 4.7 /100 | #220 | Tragic $96,783 |
Demographics Similar to Immigrants from Central America by Median Family Income
In terms of median family income, the demographic groups most similar to Immigrants from Central America are Honduran ($85,004, a difference of 0.050%), Cuban ($84,981, a difference of 0.080%), Haitian ($85,218, a difference of 0.20%), Choctaw ($84,835, a difference of 0.25%), and U.S. Virgin Islander ($85,294, a difference of 0.29%).
| Demographics | Rating | Rank | Median Family Income |
| Hispanics or Latinos | 0.0 /100 | #303 | Tragic $85,647 |
| Mexicans | 0.0 /100 | #304 | Tragic $85,618 |
| Paiute | 0.0 /100 | #305 | Tragic $85,414 |
| Immigrants | Dominica | 0.0 /100 | #306 | Tragic $85,411 |
| Chickasaw | 0.0 /100 | #307 | Tragic $85,356 |
| U.S. Virgin Islanders | 0.0 /100 | #308 | Tragic $85,294 |
| Haitians | 0.0 /100 | #309 | Tragic $85,218 |
| Immigrants | Central America | 0.0 /100 | #310 | Tragic $85,050 |
| Hondurans | 0.0 /100 | #311 | Tragic $85,004 |
| Cubans | 0.0 /100 | #312 | Tragic $84,981 |
| Choctaw | 0.0 /100 | #313 | Tragic $84,835 |
| Immigrants | Bahamas | 0.0 /100 | #314 | Tragic $84,732 |
| Apache | 0.0 /100 | #315 | Tragic $84,451 |
| Immigrants | Haiti | 0.0 /100 | #316 | Tragic $84,018 |
| Yakama | 0.0 /100 | #317 | Tragic $83,932 |