Moroccan vs Immigrants from Central America Median Family Income
COMPARE
Moroccan
Immigrants from Central America
Median Family Income
Median Family Income Comparison
Moroccans
Immigrants from Central America
$104,488
MEDIAN FAMILY INCOME
71.6/ 100
METRIC RATING
157th/ 347
METRIC RANK
$85,050
MEDIAN FAMILY INCOME
0.0/ 100
METRIC RATING
310th/ 347
METRIC RANK
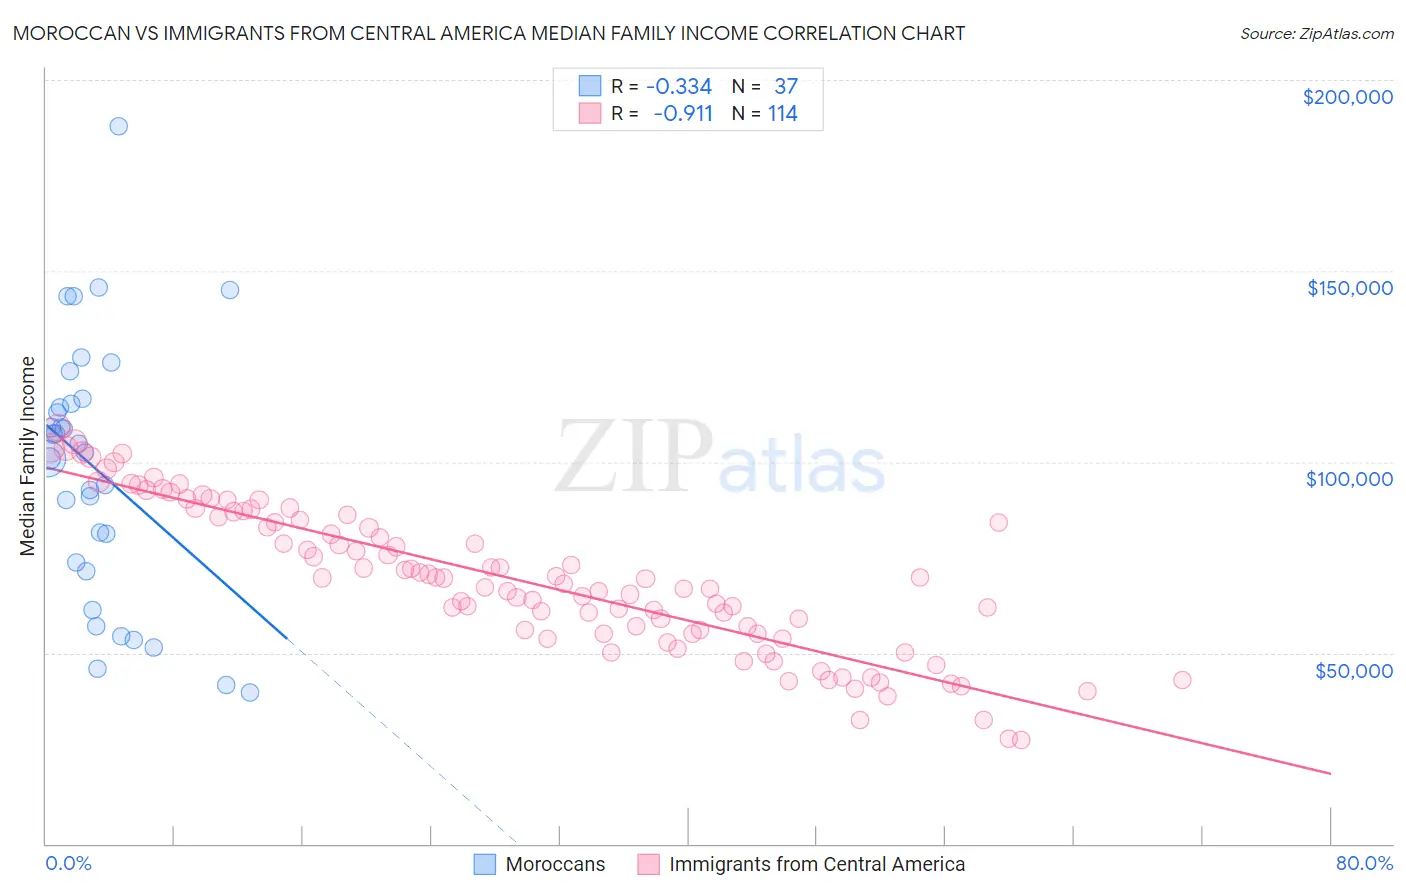
Moroccan vs Immigrants from Central America Median Family Income Correlation Chart
The statistical analysis conducted on geographies consisting of 201,715,101 people shows a mild negative correlation between the proportion of Moroccans and median family income in the United States with a correlation coefficient (R) of -0.334 and weighted average of $104,488. Similarly, the statistical analysis conducted on geographies consisting of 535,546,220 people shows a near-perfect negative correlation between the proportion of Immigrants from Central America and median family income in the United States with a correlation coefficient (R) of -0.911 and weighted average of $85,050, a difference of 22.9%.
Median Family Income Correlation Summary
| Measurement | Moroccan | Immigrants from Central America |
| Minimum | $39,712 | $27,125 |
| Maximum | $187,788 | $108,930 |
| Range | $148,076 | $81,805 |
| Mean | $98,112 | $69,313 |
| Median | $102,324 | $69,476 |
| Interquartile 25% (IQ1) | $72,461 | $55,080 |
| Interquartile 75% (IQ3) | $115,754 | $85,500 |
| Interquartile Range (IQR) | $43,293 | $30,420 |
| Standard Deviation (Sample) | $33,816 | $19,367 |
| Standard Deviation (Population) | $33,356 | $19,282 |
Similar Demographics by Median Family Income
Demographics Similar to Moroccans by Median Family Income
In terms of median family income, the demographic groups most similar to Moroccans are Scandinavian ($104,410, a difference of 0.080%), Swiss ($104,396, a difference of 0.090%), Scottish ($104,288, a difference of 0.19%), Icelander ($104,282, a difference of 0.20%), and Basque ($104,760, a difference of 0.26%).
| Demographics | Rating | Rank | Median Family Income |
| Irish | 80.5 /100 | #150 | Excellent $105,453 |
| Peruvians | 80.4 /100 | #151 | Excellent $105,444 |
| Immigrants | Albania | 79.1 /100 | #152 | Good $105,285 |
| Slavs | 77.9 /100 | #153 | Good $105,144 |
| Immigrants | Nepal | 76.3 /100 | #154 | Good $104,966 |
| Native Hawaiians | 75.8 /100 | #155 | Good $104,910 |
| Basques | 74.4 /100 | #156 | Good $104,760 |
| Moroccans | 71.6 /100 | #157 | Good $104,488 |
| Scandinavians | 70.8 /100 | #158 | Good $104,410 |
| Swiss | 70.7 /100 | #159 | Good $104,396 |
| Scottish | 69.5 /100 | #160 | Good $104,288 |
| Icelanders | 69.4 /100 | #161 | Good $104,282 |
| Immigrants | Sierra Leone | 66.2 /100 | #162 | Good $103,990 |
| Costa Ricans | 66.2 /100 | #163 | Good $103,989 |
| Sierra Leoneans | 64.7 /100 | #164 | Good $103,859 |
Demographics Similar to Immigrants from Central America by Median Family Income
In terms of median family income, the demographic groups most similar to Immigrants from Central America are Honduran ($85,004, a difference of 0.050%), Cuban ($84,981, a difference of 0.080%), Haitian ($85,218, a difference of 0.20%), Choctaw ($84,835, a difference of 0.25%), and U.S. Virgin Islander ($85,294, a difference of 0.29%).
| Demographics | Rating | Rank | Median Family Income |
| Hispanics or Latinos | 0.0 /100 | #303 | Tragic $85,647 |
| Mexicans | 0.0 /100 | #304 | Tragic $85,618 |
| Paiute | 0.0 /100 | #305 | Tragic $85,414 |
| Immigrants | Dominica | 0.0 /100 | #306 | Tragic $85,411 |
| Chickasaw | 0.0 /100 | #307 | Tragic $85,356 |
| U.S. Virgin Islanders | 0.0 /100 | #308 | Tragic $85,294 |
| Haitians | 0.0 /100 | #309 | Tragic $85,218 |
| Immigrants | Central America | 0.0 /100 | #310 | Tragic $85,050 |
| Hondurans | 0.0 /100 | #311 | Tragic $85,004 |
| Cubans | 0.0 /100 | #312 | Tragic $84,981 |
| Choctaw | 0.0 /100 | #313 | Tragic $84,835 |
| Immigrants | Bahamas | 0.0 /100 | #314 | Tragic $84,732 |
| Apache | 0.0 /100 | #315 | Tragic $84,451 |
| Immigrants | Haiti | 0.0 /100 | #316 | Tragic $84,018 |
| Yakama | 0.0 /100 | #317 | Tragic $83,932 |