Mexican vs Immigrants from Central America Median Family Income
COMPARE
Mexican
Immigrants from Central America
Median Family Income
Median Family Income Comparison
Mexicans
Immigrants from Central America
$85,618
MEDIAN FAMILY INCOME
0.0/ 100
METRIC RATING
304th/ 347
METRIC RANK
$85,050
MEDIAN FAMILY INCOME
0.0/ 100
METRIC RATING
310th/ 347
METRIC RANK
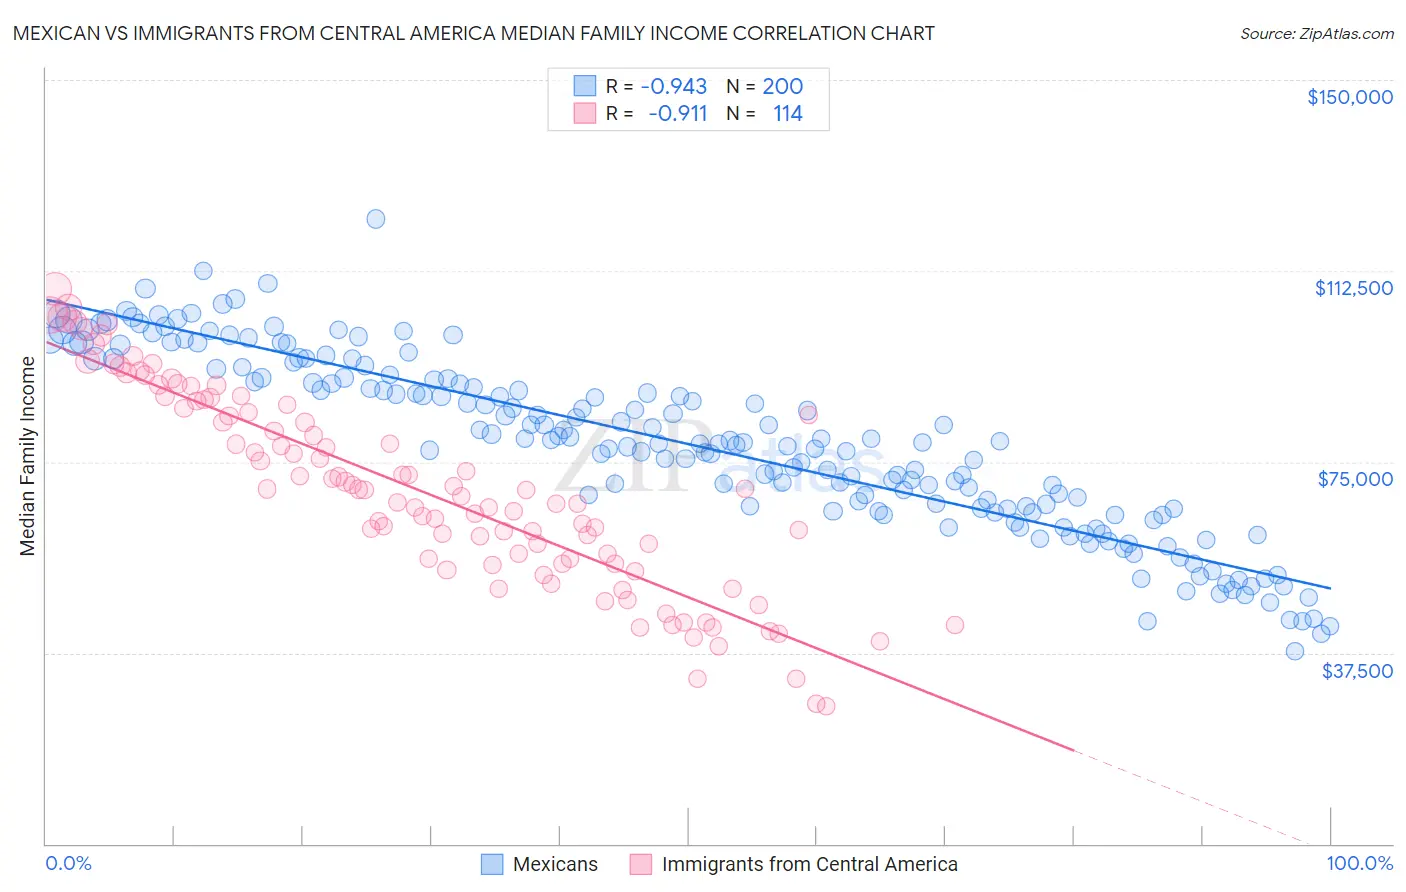
Mexican vs Immigrants from Central America Median Family Income Correlation Chart
The statistical analysis conducted on geographies consisting of 563,853,219 people shows a near-perfect negative correlation between the proportion of Mexicans and median family income in the United States with a correlation coefficient (R) of -0.943 and weighted average of $85,618. Similarly, the statistical analysis conducted on geographies consisting of 535,546,220 people shows a near-perfect negative correlation between the proportion of Immigrants from Central America and median family income in the United States with a correlation coefficient (R) of -0.911 and weighted average of $85,050, a difference of 0.67%.
Median Family Income Correlation Summary
| Measurement | Mexican | Immigrants from Central America |
| Minimum | $37,850 | $27,125 |
| Maximum | $122,714 | $108,930 |
| Range | $84,864 | $81,805 |
| Mean | $78,476 | $69,313 |
| Median | $78,807 | $69,476 |
| Interquartile 25% (IQ1) | $65,810 | $55,080 |
| Interquartile 75% (IQ3) | $91,475 | $85,500 |
| Interquartile Range (IQR) | $25,665 | $30,420 |
| Standard Deviation (Sample) | $17,414 | $19,367 |
| Standard Deviation (Population) | $17,371 | $19,282 |
Demographics Similar to Mexicans and Immigrants from Central America by Median Family Income
In terms of median family income, the demographic groups most similar to Mexicans are Hispanic or Latino ($85,647, a difference of 0.030%), Spanish American Indian ($85,728, a difference of 0.13%), Colville ($85,792, a difference of 0.20%), Paiute ($85,414, a difference of 0.24%), and Immigrants from Dominica ($85,411, a difference of 0.24%). Similarly, the demographic groups most similar to Immigrants from Central America are Honduran ($85,004, a difference of 0.050%), Cuban ($84,981, a difference of 0.080%), Haitian ($85,218, a difference of 0.20%), Choctaw ($84,835, a difference of 0.25%), and U.S. Virgin Islander ($85,294, a difference of 0.29%).
| Demographics | Rating | Rank | Median Family Income |
| Cajuns | 0.0 /100 | #297 | Tragic $87,157 |
| Immigrants | Latin America | 0.0 /100 | #298 | Tragic $86,989 |
| Chippewa | 0.0 /100 | #299 | Tragic $86,852 |
| Ottawa | 0.0 /100 | #300 | Tragic $86,380 |
| Colville | 0.0 /100 | #301 | Tragic $85,792 |
| Spanish American Indians | 0.0 /100 | #302 | Tragic $85,728 |
| Hispanics or Latinos | 0.0 /100 | #303 | Tragic $85,647 |
| Mexicans | 0.0 /100 | #304 | Tragic $85,618 |
| Paiute | 0.0 /100 | #305 | Tragic $85,414 |
| Immigrants | Dominica | 0.0 /100 | #306 | Tragic $85,411 |
| Chickasaw | 0.0 /100 | #307 | Tragic $85,356 |
| U.S. Virgin Islanders | 0.0 /100 | #308 | Tragic $85,294 |
| Haitians | 0.0 /100 | #309 | Tragic $85,218 |
| Immigrants | Central America | 0.0 /100 | #310 | Tragic $85,050 |
| Hondurans | 0.0 /100 | #311 | Tragic $85,004 |
| Cubans | 0.0 /100 | #312 | Tragic $84,981 |
| Choctaw | 0.0 /100 | #313 | Tragic $84,835 |
| Immigrants | Bahamas | 0.0 /100 | #314 | Tragic $84,732 |
| Apache | 0.0 /100 | #315 | Tragic $84,451 |
| Immigrants | Haiti | 0.0 /100 | #316 | Tragic $84,018 |
| Yakama | 0.0 /100 | #317 | Tragic $83,932 |