Danish vs Czechoslovakian Median Earnings
COMPARE
Danish
Czechoslovakian
Median Earnings
Median Earnings Comparison
Danes
Czechoslovakians
$46,392
MEDIAN EARNINGS
48.6/ 100
METRIC RATING
176th/ 347
METRIC RANK
$46,658
MEDIAN EARNINGS
57.8/ 100
METRIC RATING
166th/ 347
METRIC RANK
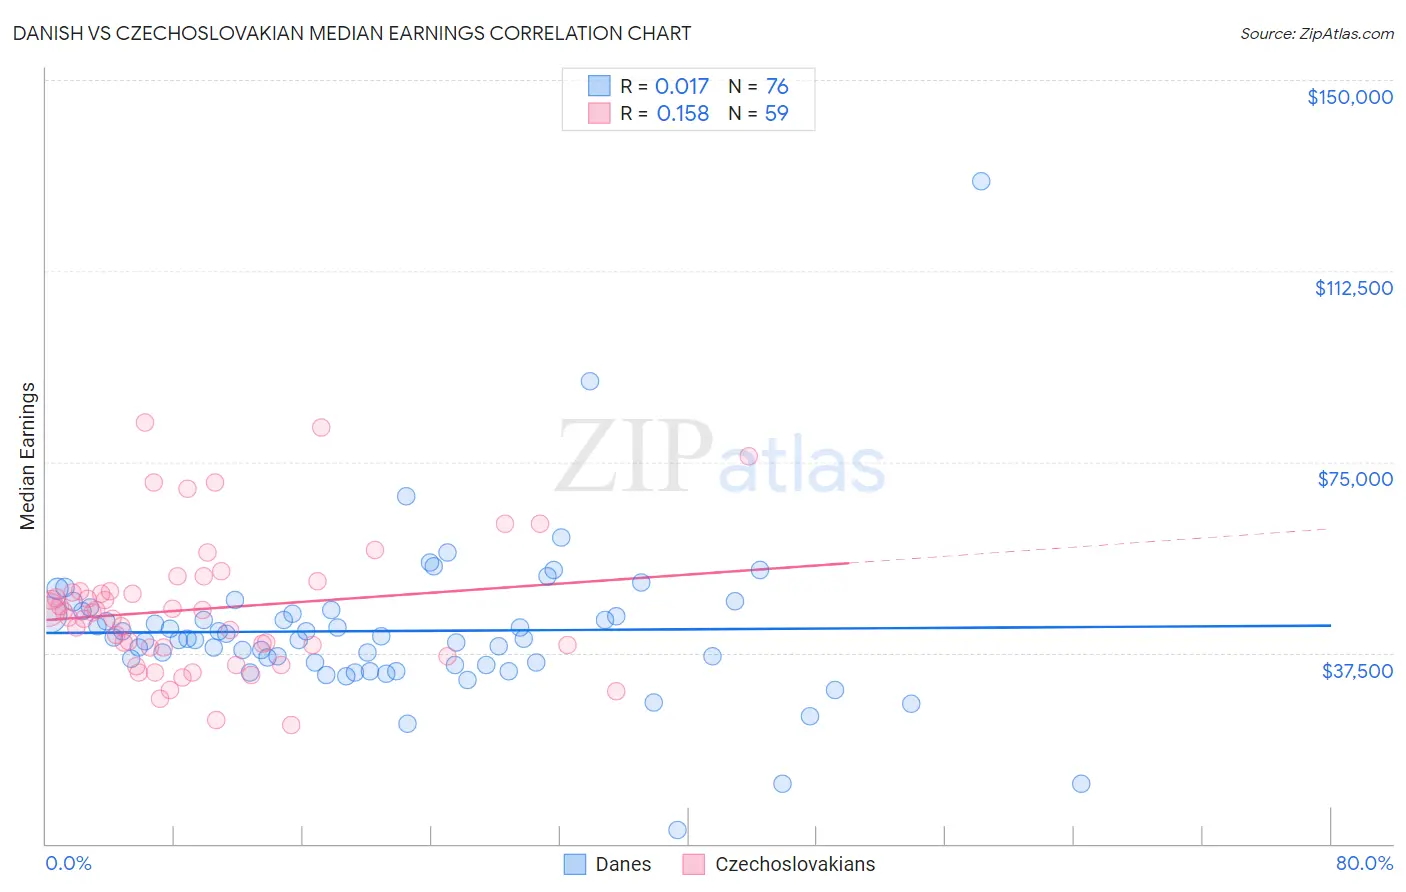
Danish vs Czechoslovakian Median Earnings Correlation Chart
The statistical analysis conducted on geographies consisting of 474,068,327 people shows no correlation between the proportion of Danes and median earnings in the United States with a correlation coefficient (R) of 0.017 and weighted average of $46,392. Similarly, the statistical analysis conducted on geographies consisting of 368,633,648 people shows a poor positive correlation between the proportion of Czechoslovakians and median earnings in the United States with a correlation coefficient (R) of 0.158 and weighted average of $46,658, a difference of 0.57%.
Median Earnings Correlation Summary
| Measurement | Danish | Czechoslovakian |
| Minimum | $2,766 | $23,333 |
| Maximum | $130,117 | $82,793 |
| Range | $127,351 | $59,460 |
| Mean | $41,795 | $46,151 |
| Median | $40,260 | $45,298 |
| Interquartile 25% (IQ1) | $35,372 | $38,524 |
| Interquartile 75% (IQ3) | $45,489 | $49,625 |
| Interquartile Range (IQR) | $10,117 | $11,101 |
| Standard Deviation (Sample) | $15,565 | $13,082 |
| Standard Deviation (Population) | $15,462 | $12,971 |
Demographics Similar to Danes and Czechoslovakians by Median Earnings
In terms of median earnings, the demographic groups most similar to Danes are Basque ($46,399, a difference of 0.020%), Belgian ($46,375, a difference of 0.040%), Scandinavian ($46,433, a difference of 0.090%), Colombian ($46,349, a difference of 0.090%), and Ghanaian ($46,440, a difference of 0.10%). Similarly, the demographic groups most similar to Czechoslovakians are Costa Rican ($46,645, a difference of 0.030%), Immigrants from Africa ($46,564, a difference of 0.20%), Immigrants from South America ($46,548, a difference of 0.24%), South American ($46,804, a difference of 0.31%), and Immigrants ($46,478, a difference of 0.39%).
| Demographics | Rating | Rank | Median Earnings |
| Immigrants | Eastern Africa | 68.0 /100 | #161 | Good $46,969 |
| South American Indians | 67.4 /100 | #162 | Good $46,952 |
| Icelanders | 66.3 /100 | #163 | Good $46,916 |
| Norwegians | 64.7 /100 | #164 | Good $46,865 |
| South Americans | 62.7 /100 | #165 | Good $46,804 |
| Czechoslovakians | 57.8 /100 | #166 | Average $46,658 |
| Costa Ricans | 57.4 /100 | #167 | Average $46,645 |
| Immigrants | Africa | 54.6 /100 | #168 | Average $46,564 |
| Immigrants | South America | 54.0 /100 | #169 | Average $46,548 |
| Immigrants | Immigrants | 51.6 /100 | #170 | Average $46,478 |
| Scottish | 51.1 /100 | #171 | Average $46,463 |
| Kenyans | 51.0 /100 | #172 | Average $46,462 |
| Ghanaians | 50.3 /100 | #173 | Average $46,440 |
| Scandinavians | 50.0 /100 | #174 | Average $46,433 |
| Basques | 48.8 /100 | #175 | Average $46,399 |
| Danes | 48.6 /100 | #176 | Average $46,392 |
| Belgians | 48.0 /100 | #177 | Average $46,375 |
| Colombians | 47.1 /100 | #178 | Average $46,349 |
| English | 46.5 /100 | #179 | Average $46,334 |
| Puget Sound Salish | 46.5 /100 | #180 | Average $46,333 |
| Immigrants | Cameroon | 46.4 /100 | #181 | Average $46,329 |