Costa Rican vs Czechoslovakian Median Earnings
COMPARE
Costa Rican
Czechoslovakian
Median Earnings
Median Earnings Comparison
Costa Ricans
Czechoslovakians
$46,645
MEDIAN EARNINGS
57.4/ 100
METRIC RATING
167th/ 347
METRIC RANK
$46,658
MEDIAN EARNINGS
57.8/ 100
METRIC RATING
166th/ 347
METRIC RANK
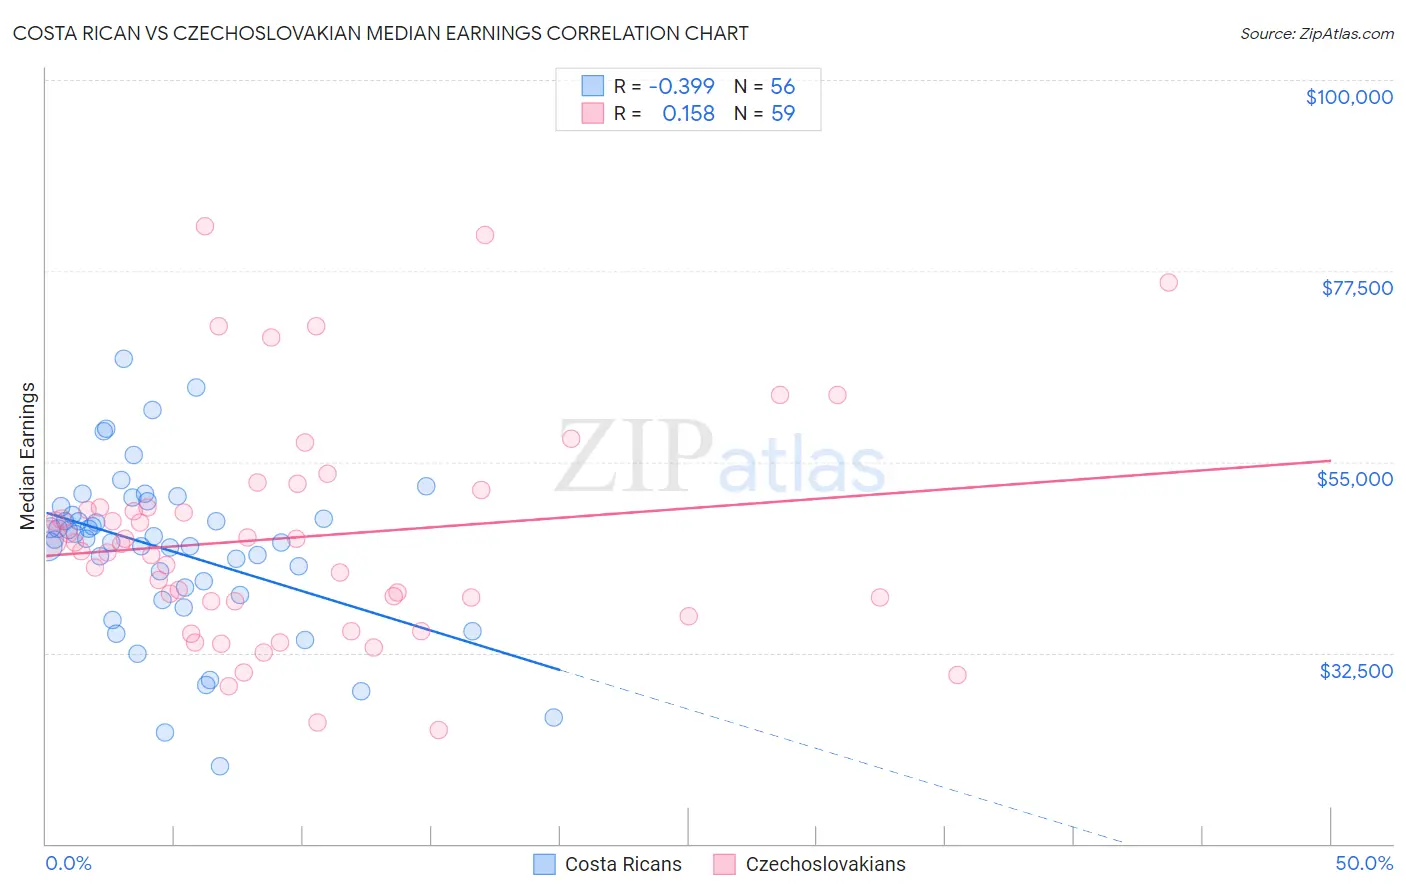
Costa Rican vs Czechoslovakian Median Earnings Correlation Chart
The statistical analysis conducted on geographies consisting of 253,579,984 people shows a mild negative correlation between the proportion of Costa Ricans and median earnings in the United States with a correlation coefficient (R) of -0.399 and weighted average of $46,645. Similarly, the statistical analysis conducted on geographies consisting of 368,633,648 people shows a poor positive correlation between the proportion of Czechoslovakians and median earnings in the United States with a correlation coefficient (R) of 0.158 and weighted average of $46,658, a difference of 0.030%.
Median Earnings Correlation Summary
| Measurement | Costa Rican | Czechoslovakian |
| Minimum | $19,205 | $23,333 |
| Maximum | $67,102 | $82,793 |
| Range | $47,897 | $59,460 |
| Mean | $44,542 | $46,151 |
| Median | $45,923 | $45,298 |
| Interquartile 25% (IQ1) | $39,792 | $38,524 |
| Interquartile 75% (IQ3) | $49,211 | $49,625 |
| Interquartile Range (IQR) | $9,420 | $11,101 |
| Standard Deviation (Sample) | $9,601 | $13,082 |
| Standard Deviation (Population) | $9,515 | $12,971 |
Demographics Similar to Costa Ricans and Czechoslovakians by Median Earnings
In terms of median earnings, the demographic groups most similar to Costa Ricans are Immigrants from Africa ($46,564, a difference of 0.17%), Immigrants from South America ($46,548, a difference of 0.21%), South American ($46,804, a difference of 0.34%), Immigrants ($46,478, a difference of 0.36%), and Scottish ($46,463, a difference of 0.39%). Similarly, the demographic groups most similar to Czechoslovakians are Immigrants from Africa ($46,564, a difference of 0.20%), Immigrants from South America ($46,548, a difference of 0.24%), South American ($46,804, a difference of 0.31%), Immigrants ($46,478, a difference of 0.39%), and Scottish ($46,463, a difference of 0.42%).
| Demographics | Rating | Rank | Median Earnings |
| Irish | 76.6 /100 | #156 | Good $47,276 |
| Czechs | 75.1 /100 | #157 | Good $47,221 |
| Slovaks | 71.7 /100 | #158 | Good $47,095 |
| Immigrants | Peru | 69.6 /100 | #159 | Good $47,025 |
| Alsatians | 69.6 /100 | #160 | Good $47,023 |
| Immigrants | Eastern Africa | 68.0 /100 | #161 | Good $46,969 |
| South American Indians | 67.4 /100 | #162 | Good $46,952 |
| Icelanders | 66.3 /100 | #163 | Good $46,916 |
| Norwegians | 64.7 /100 | #164 | Good $46,865 |
| South Americans | 62.7 /100 | #165 | Good $46,804 |
| Czechoslovakians | 57.8 /100 | #166 | Average $46,658 |
| Costa Ricans | 57.4 /100 | #167 | Average $46,645 |
| Immigrants | Africa | 54.6 /100 | #168 | Average $46,564 |
| Immigrants | South America | 54.0 /100 | #169 | Average $46,548 |
| Immigrants | Immigrants | 51.6 /100 | #170 | Average $46,478 |
| Scottish | 51.1 /100 | #171 | Average $46,463 |
| Kenyans | 51.0 /100 | #172 | Average $46,462 |
| Ghanaians | 50.3 /100 | #173 | Average $46,440 |
| Scandinavians | 50.0 /100 | #174 | Average $46,433 |
| Basques | 48.8 /100 | #175 | Average $46,399 |
| Danes | 48.6 /100 | #176 | Average $46,392 |