Cape Verdean vs Immigrants from Trinidad and Tobago Disability Age Under 5
COMPARE
Cape Verdean
Immigrants from Trinidad and Tobago
Disability Age Under 5
Disability Age Under 5 Comparison
Cape Verdeans
Immigrants from Trinidad and Tobago
1.7%
DISABILITY AGE UNDER 5
0.0/ 100
METRIC RATING
309th/ 347
METRIC RANK
1.1%
DISABILITY AGE UNDER 5
98.0/ 100
METRIC RATING
80th/ 347
METRIC RANK
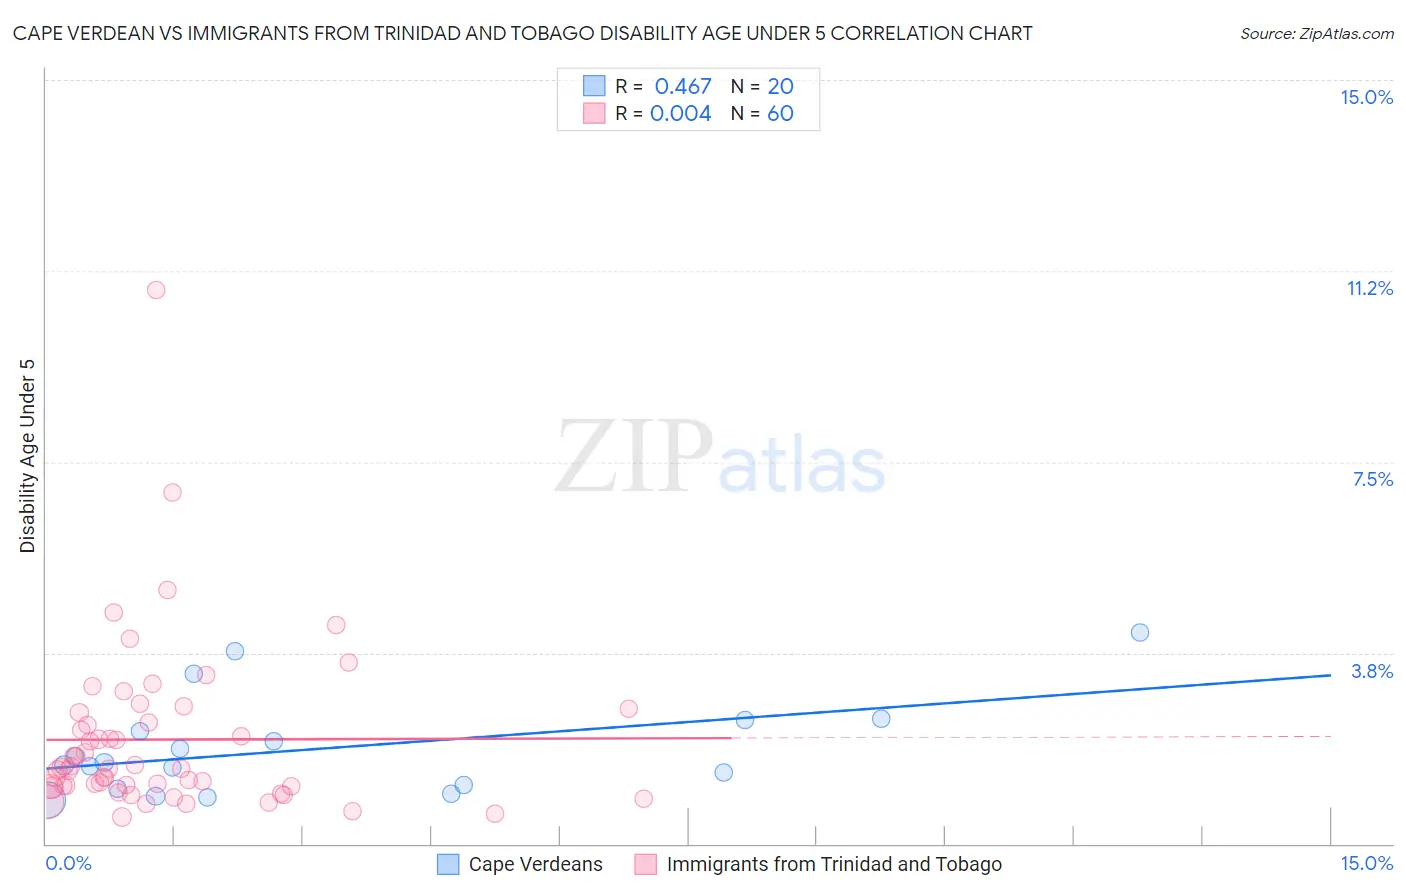
Cape Verdean vs Immigrants from Trinidad and Tobago Disability Age Under 5 Correlation Chart
The statistical analysis conducted on geographies consisting of 80,346,766 people shows a moderate positive correlation between the proportion of Cape Verdeans and percentage of population with a disability under the age of 5 in the United States with a correlation coefficient (R) of 0.467 and weighted average of 1.7%. Similarly, the statistical analysis conducted on geographies consisting of 139,979,956 people shows no correlation between the proportion of Immigrants from Trinidad and Tobago and percentage of population with a disability under the age of 5 in the United States with a correlation coefficient (R) of 0.004 and weighted average of 1.1%, a difference of 46.7%.
Disability Age Under 5 Correlation Summary
| Measurement | Cape Verdean | Immigrants from Trinidad and Tobago |
| Minimum | 0.85% | 0.53% |
| Maximum | 4.1% | 10.9% |
| Range | 3.3% | 10.3% |
| Mean | 1.9% | 2.0% |
| Median | 1.6% | 1.5% |
| Interquartile 25% (IQ1) | 1.1% | 1.1% |
| Interquartile 75% (IQ3) | 2.3% | 2.5% |
| Interquartile Range (IQR) | 1.2% | 1.4% |
| Standard Deviation (Sample) | 0.95% | 1.7% |
| Standard Deviation (Population) | 0.93% | 1.7% |
Similar Demographics by Disability Age Under 5
Demographics Similar to Cape Verdeans by Disability Age Under 5
In terms of disability age under 5, the demographic groups most similar to Cape Verdeans are White/Caucasian (1.7%, a difference of 0.070%), Navajo (1.6%, a difference of 0.63%), English (1.7%, a difference of 0.66%), Puerto Rican (1.7%, a difference of 0.70%), and Scottish (1.6%, a difference of 0.77%).
| Demographics | Rating | Rank | Disability Age Under 5 |
| Welsh | 0.0 /100 | #302 | Tragic 1.6% |
| Swiss | 0.0 /100 | #303 | Tragic 1.6% |
| Seminole | 0.0 /100 | #304 | Tragic 1.6% |
| Blackfeet | 0.0 /100 | #305 | Tragic 1.6% |
| Creek | 0.0 /100 | #306 | Tragic 1.6% |
| Scottish | 0.0 /100 | #307 | Tragic 1.6% |
| Navajo | 0.0 /100 | #308 | Tragic 1.6% |
| Cape Verdeans | 0.0 /100 | #309 | Tragic 1.7% |
| Whites/Caucasians | 0.0 /100 | #310 | Tragic 1.7% |
| English | 0.0 /100 | #311 | Tragic 1.7% |
| Puerto Ricans | 0.0 /100 | #312 | Tragic 1.7% |
| Celtics | 0.0 /100 | #313 | Tragic 1.7% |
| Norwegians | 0.0 /100 | #314 | Tragic 1.7% |
| Dutch | 0.0 /100 | #315 | Tragic 1.7% |
| Immigrants | Cabo Verde | 0.0 /100 | #316 | Tragic 1.7% |
Demographics Similar to Immigrants from Trinidad and Tobago by Disability Age Under 5
In terms of disability age under 5, the demographic groups most similar to Immigrants from Trinidad and Tobago are Hmong (1.1%, a difference of 0.020%), Turkish (1.1%, a difference of 0.020%), West Indian (1.1%, a difference of 0.040%), Immigrants from Jordan (1.1%, a difference of 0.13%), and Immigrants from Syria (1.1%, a difference of 0.14%).
| Demographics | Rating | Rank | Disability Age Under 5 |
| Immigrants | Sri Lanka | 98.5 /100 | #73 | Exceptional 1.1% |
| Jordanians | 98.5 /100 | #74 | Exceptional 1.1% |
| Immigrants | Pakistan | 98.4 /100 | #75 | Exceptional 1.1% |
| Immigrants | Burma/Myanmar | 98.2 /100 | #76 | Exceptional 1.1% |
| Immigrants | Denmark | 98.1 /100 | #77 | Exceptional 1.1% |
| West Indians | 98.0 /100 | #78 | Exceptional 1.1% |
| Hmong | 98.0 /100 | #79 | Exceptional 1.1% |
| Immigrants | Trinidad and Tobago | 98.0 /100 | #80 | Exceptional 1.1% |
| Turks | 98.0 /100 | #81 | Exceptional 1.1% |
| Immigrants | Jordan | 97.9 /100 | #82 | Exceptional 1.1% |
| Immigrants | Syria | 97.9 /100 | #83 | Exceptional 1.1% |
| Immigrants | Zaire | 97.8 /100 | #84 | Exceptional 1.1% |
| Sudanese | 97.7 /100 | #85 | Exceptional 1.1% |
| Okinawans | 97.6 /100 | #86 | Exceptional 1.1% |
| Ugandans | 97.5 /100 | #87 | Exceptional 1.1% |