Cape Verdean vs Immigrants from Trinidad and Tobago Householder Income Over 65 years
COMPARE
Cape Verdean
Immigrants from Trinidad and Tobago
Householder Income Over 65 years
Householder Income Over 65 years Comparison
Cape Verdeans
Immigrants from Trinidad and Tobago
$50,077
HOUSEHOLDER INCOME OVER 65 YEARS
0.0/ 100
METRIC RATING
333rd/ 347
METRIC RANK
$55,598
HOUSEHOLDER INCOME OVER 65 YEARS
0.4/ 100
METRIC RATING
253rd/ 347
METRIC RANK
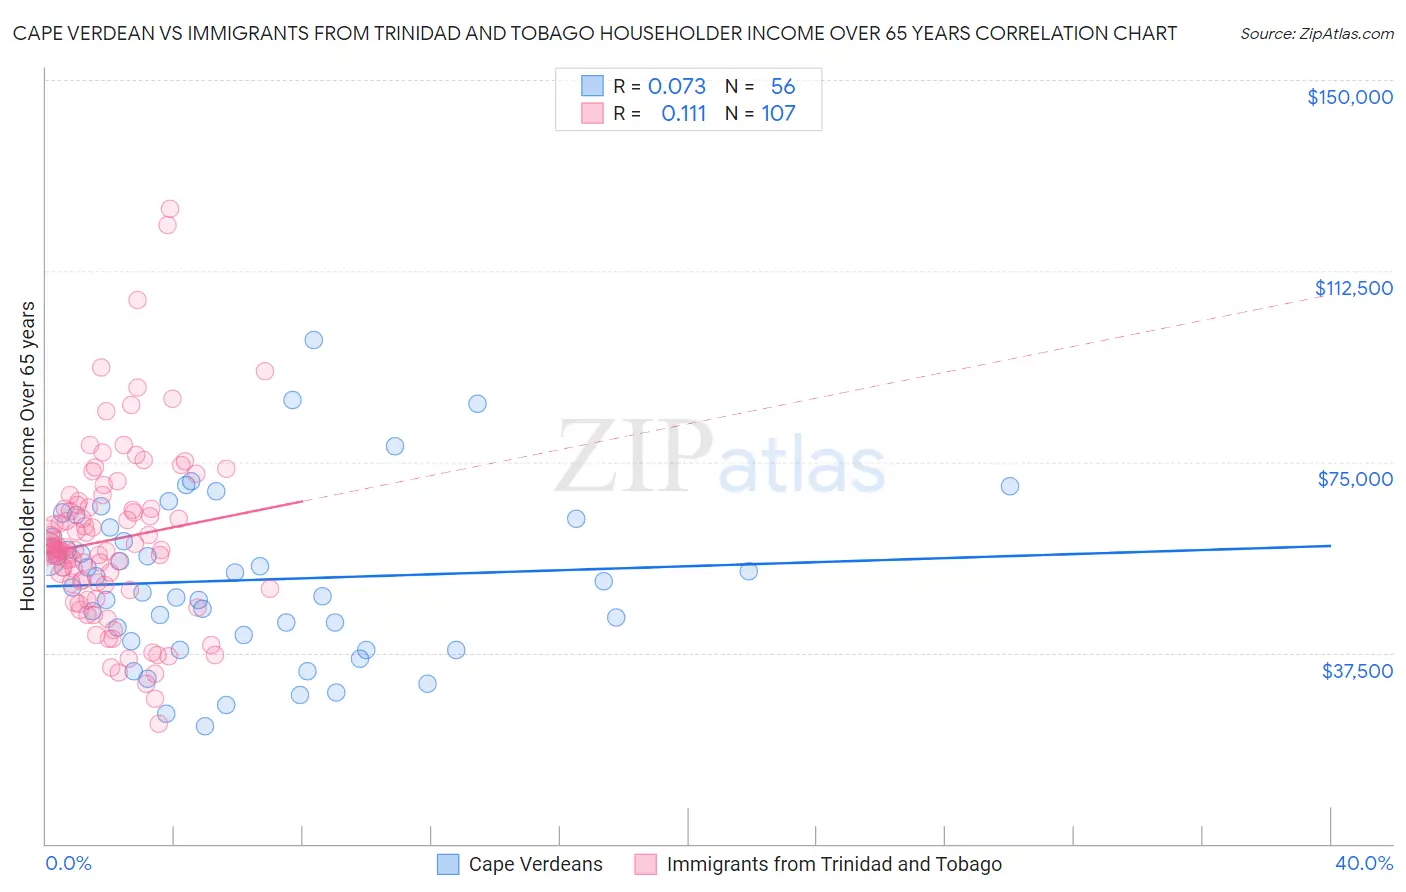
Cape Verdean vs Immigrants from Trinidad and Tobago Householder Income Over 65 years Correlation Chart
The statistical analysis conducted on geographies consisting of 107,432,324 people shows a slight positive correlation between the proportion of Cape Verdeans and household income with householder over the age of 65 in the United States with a correlation coefficient (R) of 0.073 and weighted average of $50,077. Similarly, the statistical analysis conducted on geographies consisting of 223,183,074 people shows a poor positive correlation between the proportion of Immigrants from Trinidad and Tobago and household income with householder over the age of 65 in the United States with a correlation coefficient (R) of 0.111 and weighted average of $55,598, a difference of 11.0%.
Householder Income Over 65 years Correlation Summary
| Measurement | Cape Verdean | Immigrants from Trinidad and Tobago |
| Minimum | $23,194 | $23,659 |
| Maximum | $98,819 | $124,816 |
| Range | $75,625 | $101,157 |
| Mean | $51,774 | $59,659 |
| Median | $50,968 | $57,844 |
| Interquartile 25% (IQ1) | $40,388 | $50,192 |
| Interquartile 75% (IQ3) | $61,045 | $65,956 |
| Interquartile Range (IQR) | $20,657 | $15,764 |
| Standard Deviation (Sample) | $15,999 | $17,128 |
| Standard Deviation (Population) | $15,855 | $17,048 |
Similar Demographics by Householder Income Over 65 years
Demographics Similar to Cape Verdeans by Householder Income Over 65 years
In terms of householder income over 65 years, the demographic groups most similar to Cape Verdeans are Immigrants from Dominica ($50,071, a difference of 0.010%), Dutch West Indian ($50,475, a difference of 0.79%), Pima ($50,539, a difference of 0.92%), Immigrants from Grenada ($50,747, a difference of 1.3%), and Black/African American ($50,779, a difference of 1.4%).
| Demographics | Rating | Rank | Householder Income Over 65 years |
| Kiowa | 0.0 /100 | #326 | Tragic $51,140 |
| Bahamians | 0.0 /100 | #327 | Tragic $51,000 |
| Hopi | 0.0 /100 | #328 | Tragic $50,925 |
| Blacks/African Americans | 0.0 /100 | #329 | Tragic $50,779 |
| Immigrants | Grenada | 0.0 /100 | #330 | Tragic $50,747 |
| Pima | 0.0 /100 | #331 | Tragic $50,539 |
| Dutch West Indians | 0.0 /100 | #332 | Tragic $50,475 |
| Cape Verdeans | 0.0 /100 | #333 | Tragic $50,077 |
| Immigrants | Dominica | 0.0 /100 | #334 | Tragic $50,071 |
| Crow | 0.0 /100 | #335 | Tragic $49,234 |
| Cubans | 0.0 /100 | #336 | Tragic $49,152 |
| Tohono O'odham | 0.0 /100 | #337 | Tragic $49,121 |
| Immigrants | Caribbean | 0.0 /100 | #338 | Tragic $48,535 |
| Navajo | 0.0 /100 | #339 | Tragic $47,722 |
| Immigrants | Yemen | 0.0 /100 | #340 | Tragic $47,527 |
Demographics Similar to Immigrants from Trinidad and Tobago by Householder Income Over 65 years
In terms of householder income over 65 years, the demographic groups most similar to Immigrants from Trinidad and Tobago are American ($55,527, a difference of 0.13%), Osage ($55,677, a difference of 0.14%), Immigrants from Bangladesh ($55,394, a difference of 0.37%), German Russian ($55,356, a difference of 0.44%), and Trinidadian and Tobagonian ($55,327, a difference of 0.49%).
| Demographics | Rating | Rank | Householder Income Over 65 years |
| Central Americans | 0.8 /100 | #246 | Tragic $56,321 |
| Yakama | 0.7 /100 | #247 | Tragic $56,234 |
| Vietnamese | 0.6 /100 | #248 | Tragic $56,143 |
| Mexican American Indians | 0.6 /100 | #249 | Tragic $56,089 |
| Immigrants | Bosnia and Herzegovina | 0.5 /100 | #250 | Tragic $55,986 |
| Immigrants | Portugal | 0.5 /100 | #251 | Tragic $55,924 |
| Osage | 0.4 /100 | #252 | Tragic $55,677 |
| Immigrants | Trinidad and Tobago | 0.4 /100 | #253 | Tragic $55,598 |
| Americans | 0.3 /100 | #254 | Tragic $55,527 |
| Immigrants | Bangladesh | 0.3 /100 | #255 | Tragic $55,394 |
| German Russians | 0.3 /100 | #256 | Tragic $55,356 |
| Trinidadians and Tobagonians | 0.3 /100 | #257 | Tragic $55,327 |
| Ecuadorians | 0.2 /100 | #258 | Tragic $54,958 |
| West Indians | 0.2 /100 | #259 | Tragic $54,936 |
| Immigrants | West Indies | 0.2 /100 | #260 | Tragic $54,927 |