Cape Verdean vs Immigrants from Bolivia Median Earnings
COMPARE
Cape Verdean
Immigrants from Bolivia
Median Earnings
Median Earnings Comparison
Cape Verdeans
Immigrants from Bolivia
$44,640
MEDIAN EARNINGS
7.5/ 100
METRIC RATING
234th/ 347
METRIC RANK
$51,605
MEDIAN EARNINGS
99.9/ 100
METRIC RATING
58th/ 347
METRIC RANK
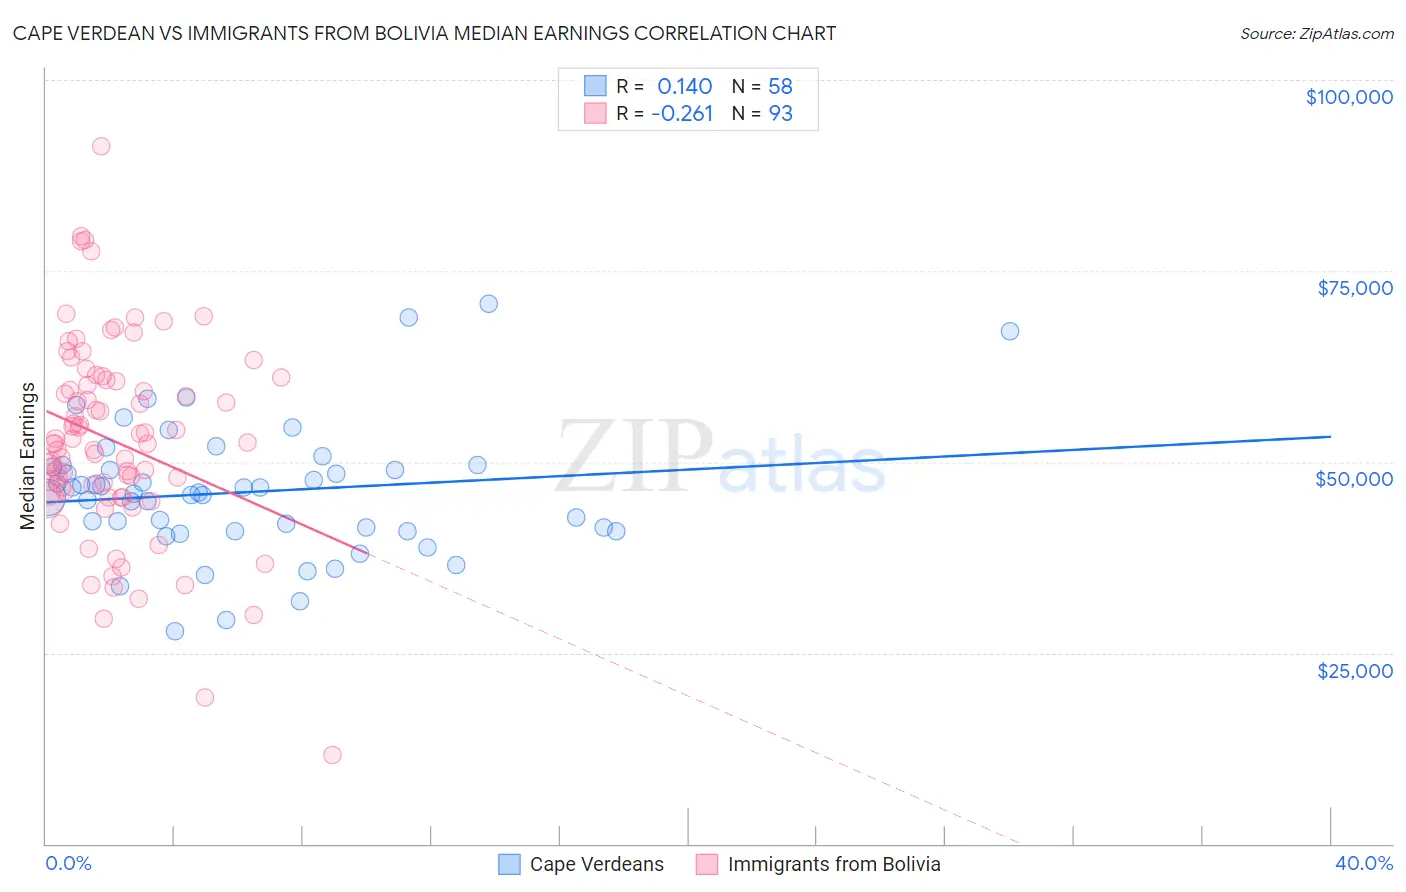
Cape Verdean vs Immigrants from Bolivia Median Earnings Correlation Chart
The statistical analysis conducted on geographies consisting of 107,579,856 people shows a poor positive correlation between the proportion of Cape Verdeans and median earnings in the United States with a correlation coefficient (R) of 0.140 and weighted average of $44,640. Similarly, the statistical analysis conducted on geographies consisting of 158,712,094 people shows a weak negative correlation between the proportion of Immigrants from Bolivia and median earnings in the United States with a correlation coefficient (R) of -0.261 and weighted average of $51,605, a difference of 15.6%.
Median Earnings Correlation Summary
| Measurement | Cape Verdean | Immigrants from Bolivia |
| Minimum | $27,841 | $11,650 |
| Maximum | $70,758 | $91,262 |
| Range | $42,917 | $79,612 |
| Mean | $46,038 | $52,755 |
| Median | $45,876 | $52,407 |
| Interquartile 25% (IQ1) | $40,962 | $46,026 |
| Interquartile 75% (IQ3) | $49,336 | $60,689 |
| Interquartile Range (IQR) | $8,374 | $14,663 |
| Standard Deviation (Sample) | $8,551 | $12,931 |
| Standard Deviation (Population) | $8,477 | $12,861 |
Similar Demographics by Median Earnings
Demographics Similar to Cape Verdeans by Median Earnings
In terms of median earnings, the demographic groups most similar to Cape Verdeans are Venezuelan ($44,580, a difference of 0.14%), British West Indian ($44,552, a difference of 0.20%), Immigrants from Sudan ($44,767, a difference of 0.28%), Delaware ($44,783, a difference of 0.32%), and Immigrants from Ecuador ($44,462, a difference of 0.40%).
| Demographics | Rating | Rank | Median Earnings |
| Native Hawaiians | 12.2 /100 | #227 | Poor $45,027 |
| Immigrants | Iraq | 11.6 /100 | #228 | Poor $44,988 |
| Scotch-Irish | 10.7 /100 | #229 | Poor $44,924 |
| Immigrants | Western Africa | 10.3 /100 | #230 | Poor $44,893 |
| Japanese | 9.5 /100 | #231 | Tragic $44,825 |
| Delaware | 9.0 /100 | #232 | Tragic $44,783 |
| Immigrants | Sudan | 8.8 /100 | #233 | Tragic $44,767 |
| Cape Verdeans | 7.5 /100 | #234 | Tragic $44,640 |
| Venezuelans | 6.9 /100 | #235 | Tragic $44,580 |
| British West Indians | 6.7 /100 | #236 | Tragic $44,552 |
| Immigrants | Ecuador | 5.9 /100 | #237 | Tragic $44,462 |
| Sudanese | 5.6 /100 | #238 | Tragic $44,419 |
| Senegalese | 5.3 /100 | #239 | Tragic $44,373 |
| Aleuts | 4.4 /100 | #240 | Tragic $44,241 |
| Samoans | 4.2 /100 | #241 | Tragic $44,206 |
Demographics Similar to Immigrants from Bolivia by Median Earnings
In terms of median earnings, the demographic groups most similar to Immigrants from Bolivia are Immigrants from Eastern Europe ($51,624, a difference of 0.040%), Immigrants from Croatia ($51,581, a difference of 0.050%), Immigrants from Serbia ($51,557, a difference of 0.090%), Immigrants from Latvia ($51,555, a difference of 0.10%), and Immigrants from Pakistan ($51,693, a difference of 0.17%).
| Demographics | Rating | Rank | Median Earnings |
| Immigrants | Austria | 99.9 /100 | #51 | Exceptional $51,826 |
| Estonians | 99.9 /100 | #52 | Exceptional $51,772 |
| Immigrants | Norway | 99.9 /100 | #53 | Exceptional $51,758 |
| Immigrants | Indonesia | 99.9 /100 | #54 | Exceptional $51,715 |
| Egyptians | 99.9 /100 | #55 | Exceptional $51,701 |
| Immigrants | Pakistan | 99.9 /100 | #56 | Exceptional $51,693 |
| Immigrants | Eastern Europe | 99.9 /100 | #57 | Exceptional $51,624 |
| Immigrants | Bolivia | 99.9 /100 | #58 | Exceptional $51,605 |
| Immigrants | Croatia | 99.9 /100 | #59 | Exceptional $51,581 |
| Immigrants | Serbia | 99.9 /100 | #60 | Exceptional $51,557 |
| Immigrants | Latvia | 99.9 /100 | #61 | Exceptional $51,555 |
| Immigrants | Romania | 99.9 /100 | #62 | Exceptional $51,337 |
| Immigrants | Bulgaria | 99.9 /100 | #63 | Exceptional $51,318 |
| New Zealanders | 99.9 /100 | #64 | Exceptional $51,246 |
| Greeks | 99.9 /100 | #65 | Exceptional $51,164 |