Cape Verdean vs Immigrants from Eritrea Unemployment Among Ages 25 to 29 years
COMPARE
Cape Verdean
Immigrants from Eritrea
Unemployment Among Ages 25 to 29 years
Unemployment Among Ages 25 to 29 years Comparison
Cape Verdeans
Immigrants from Eritrea
7.0%
UNEMPLOYMENT AMONG AGES 25 TO 29 YEARS
1.9/ 100
METRIC RATING
236th/ 347
METRIC RANK
5.9%
UNEMPLOYMENT AMONG AGES 25 TO 29 YEARS
99.9/ 100
METRIC RATING
20th/ 347
METRIC RANK
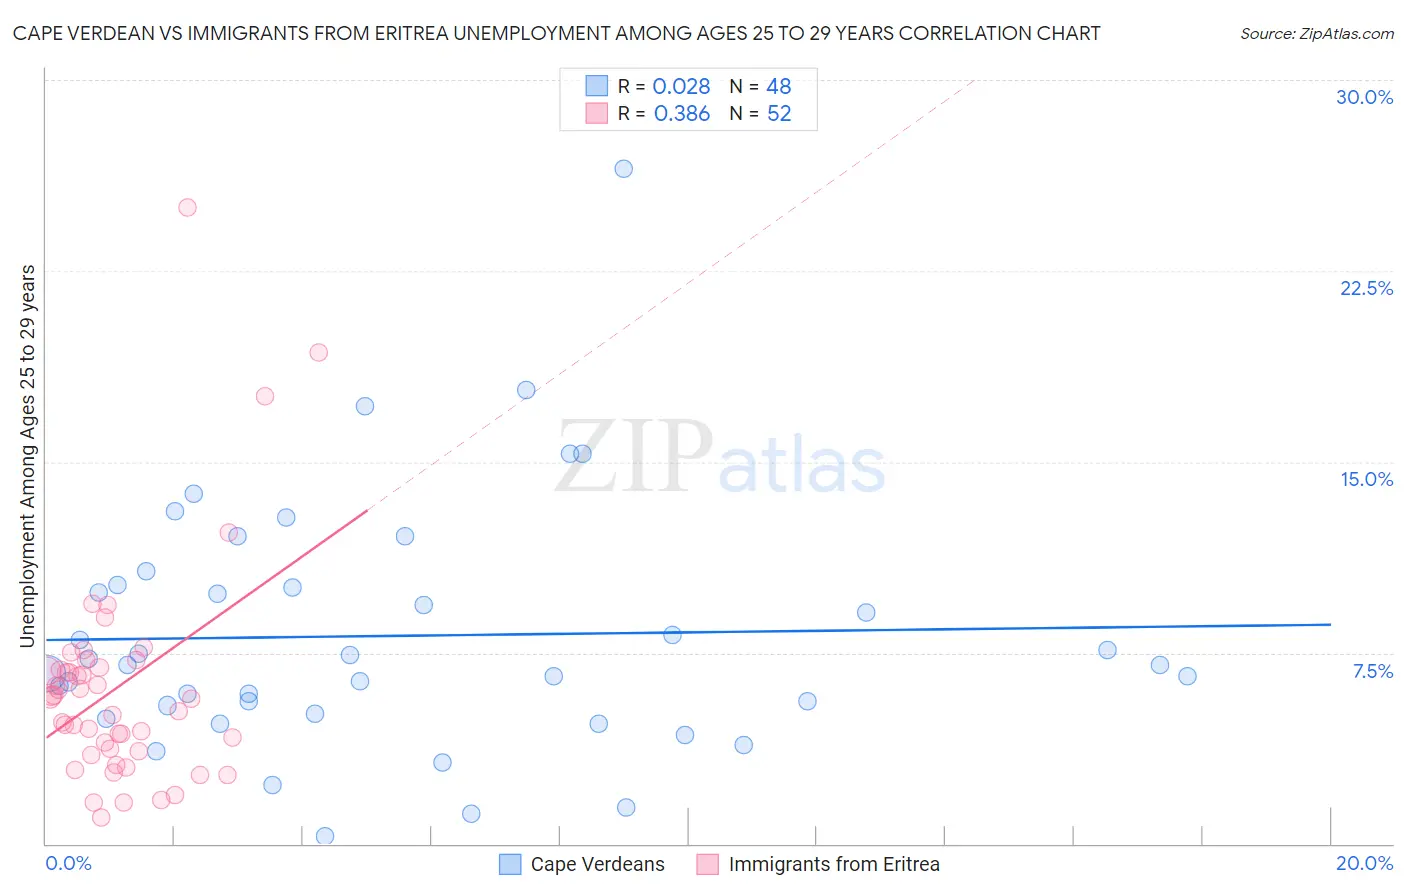
Cape Verdean vs Immigrants from Eritrea Unemployment Among Ages 25 to 29 years Correlation Chart
The statistical analysis conducted on geographies consisting of 105,856,237 people shows no correlation between the proportion of Cape Verdeans and unemployment rate among population between the ages 25 and 29 in the United States with a correlation coefficient (R) of 0.028 and weighted average of 7.0%. Similarly, the statistical analysis conducted on geographies consisting of 104,216,645 people shows a mild positive correlation between the proportion of Immigrants from Eritrea and unemployment rate among population between the ages 25 and 29 in the United States with a correlation coefficient (R) of 0.386 and weighted average of 5.9%, a difference of 18.6%.
Unemployment Among Ages 25 to 29 years Correlation Summary
| Measurement | Cape Verdean | Immigrants from Eritrea |
| Minimum | 0.30% | 1.1% |
| Maximum | 26.5% | 25.0% |
| Range | 26.2% | 23.9% |
| Mean | 8.2% | 6.2% |
| Median | 7.0% | 5.7% |
| Interquartile 25% (IQ1) | 5.3% | 3.7% |
| Interquartile 75% (IQ3) | 10.1% | 6.9% |
| Interquartile Range (IQR) | 4.9% | 3.2% |
| Standard Deviation (Sample) | 4.9% | 4.3% |
| Standard Deviation (Population) | 4.8% | 4.3% |
Similar Demographics by Unemployment Among Ages 25 to 29 years
Demographics Similar to Cape Verdeans by Unemployment Among Ages 25 to 29 years
In terms of unemployment among ages 25 to 29 years, the demographic groups most similar to Cape Verdeans are Puget Sound Salish (7.1%, a difference of 0.070%), Honduran (7.1%, a difference of 0.090%), Panamanian (7.0%, a difference of 0.14%), French Canadian (7.0%, a difference of 0.30%), and Immigrants from Honduras (7.0%, a difference of 0.32%).
| Demographics | Rating | Rank | Unemployment Among Ages 25 to 29 years |
| Bermudans | 3.8 /100 | #229 | Tragic 7.0% |
| Immigrants | El Salvador | 3.6 /100 | #230 | Tragic 7.0% |
| Central Americans | 3.0 /100 | #231 | Tragic 7.0% |
| Spanish Americans | 2.7 /100 | #232 | Tragic 7.0% |
| Immigrants | Honduras | 2.4 /100 | #233 | Tragic 7.0% |
| French Canadians | 2.4 /100 | #234 | Tragic 7.0% |
| Panamanians | 2.1 /100 | #235 | Tragic 7.0% |
| Cape Verdeans | 1.9 /100 | #236 | Tragic 7.0% |
| Puget Sound Salish | 1.8 /100 | #237 | Tragic 7.1% |
| Hondurans | 1.8 /100 | #238 | Tragic 7.1% |
| Potawatomi | 1.3 /100 | #239 | Tragic 7.1% |
| Native Hawaiians | 1.3 /100 | #240 | Tragic 7.1% |
| Immigrants | Sierra Leone | 1.3 /100 | #241 | Tragic 7.1% |
| Spanish American Indians | 1.1 /100 | #242 | Tragic 7.1% |
| Yaqui | 1.0 /100 | #243 | Tragic 7.1% |
Demographics Similar to Immigrants from Eritrea by Unemployment Among Ages 25 to 29 years
In terms of unemployment among ages 25 to 29 years, the demographic groups most similar to Immigrants from Eritrea are Thai (5.9%, a difference of 0.18%), Immigrants from Singapore (5.9%, a difference of 0.34%), Immigrants from Ethiopia (6.0%, a difference of 0.34%), Bolivian (5.9%, a difference of 0.44%), and Immigrants from Bulgaria (5.9%, a difference of 0.58%).
| Demographics | Rating | Rank | Unemployment Among Ages 25 to 29 years |
| Immigrants | Bolivia | 100.0 /100 | #13 | Exceptional 5.9% |
| Immigrants | Kuwait | 99.9 /100 | #14 | Exceptional 5.9% |
| Cubans | 99.9 /100 | #15 | Exceptional 5.9% |
| Immigrants | Bulgaria | 99.9 /100 | #16 | Exceptional 5.9% |
| Bolivians | 99.9 /100 | #17 | Exceptional 5.9% |
| Immigrants | Singapore | 99.9 /100 | #18 | Exceptional 5.9% |
| Thais | 99.9 /100 | #19 | Exceptional 5.9% |
| Immigrants | Eritrea | 99.9 /100 | #20 | Exceptional 5.9% |
| Immigrants | Ethiopia | 99.9 /100 | #21 | Exceptional 6.0% |
| Immigrants | Japan | 99.9 /100 | #22 | Exceptional 6.0% |
| Immigrants | Venezuela | 99.8 /100 | #23 | Exceptional 6.0% |
| Norwegians | 99.8 /100 | #24 | Exceptional 6.0% |
| New Zealanders | 99.8 /100 | #25 | Exceptional 6.0% |
| Immigrants | Eastern Africa | 99.8 /100 | #26 | Exceptional 6.0% |
| Immigrants | Zaire | 99.7 /100 | #27 | Exceptional 6.0% |