Arapaho vs Immigrants from Korea Median Male Earnings
COMPARE
Arapaho
Immigrants from Korea
Median Male Earnings
Median Male Earnings Comparison
Arapaho
Immigrants from Korea
$41,758
MEDIAN MALE EARNINGS
0.0/ 100
METRIC RATING
342nd/ 347
METRIC RANK
$65,079
MEDIAN MALE EARNINGS
100.0/ 100
METRIC RATING
23rd/ 347
METRIC RANK
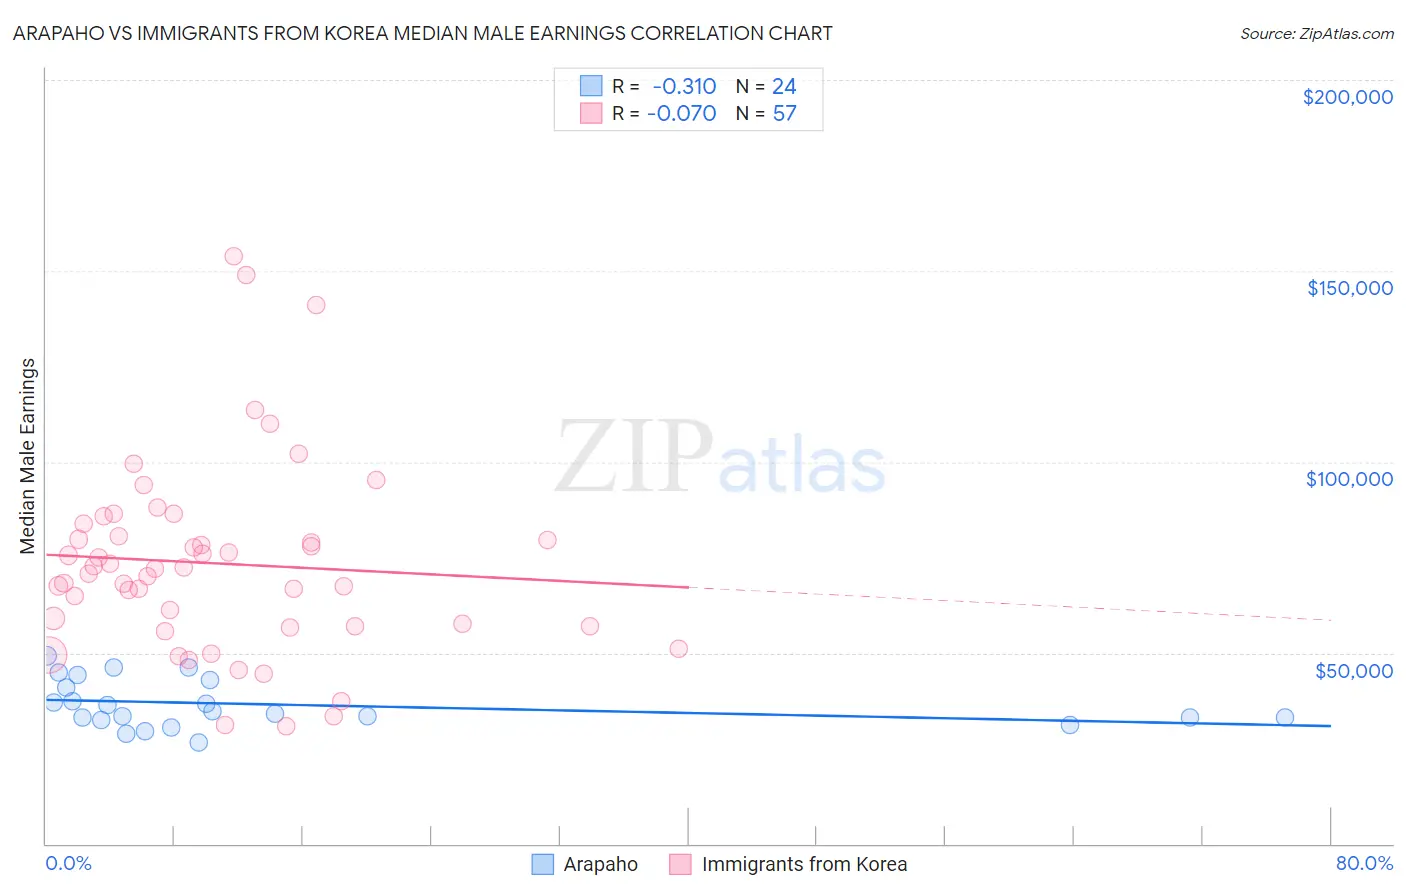
Arapaho vs Immigrants from Korea Median Male Earnings Correlation Chart
The statistical analysis conducted on geographies consisting of 29,771,934 people shows a mild negative correlation between the proportion of Arapaho and median male earnings in the United States with a correlation coefficient (R) of -0.310 and weighted average of $41,758. Similarly, the statistical analysis conducted on geographies consisting of 416,203,155 people shows a slight negative correlation between the proportion of Immigrants from Korea and median male earnings in the United States with a correlation coefficient (R) of -0.070 and weighted average of $65,079, a difference of 55.8%.
Median Male Earnings Correlation Summary
| Measurement | Arapaho | Immigrants from Korea |
| Minimum | $26,527 | $30,795 |
| Maximum | $49,176 | $153,870 |
| Range | $22,649 | $123,075 |
| Mean | $36,456 | $73,429 |
| Median | $34,270 | $71,921 |
| Interquartile 25% (IQ1) | $32,621 | $56,978 |
| Interquartile 75% (IQ3) | $41,897 | $82,188 |
| Interquartile Range (IQR) | $9,276 | $25,211 |
| Standard Deviation (Sample) | $6,211 | $25,444 |
| Standard Deviation (Population) | $6,080 | $25,220 |
Similar Demographics by Median Male Earnings
Demographics Similar to Arapaho by Median Male Earnings
In terms of median male earnings, the demographic groups most similar to Arapaho are Lumbee ($41,715, a difference of 0.10%), Hopi ($42,060, a difference of 0.72%), Navajo ($42,098, a difference of 0.81%), Pueblo ($41,314, a difference of 1.1%), and Pima ($42,357, a difference of 1.4%).
| Demographics | Rating | Rank | Median Male Earnings |
| Immigrants | Congo | 0.0 /100 | #333 | Tragic $44,204 |
| Immigrants | Yemen | 0.0 /100 | #334 | Tragic $44,083 |
| Spanish American Indians | 0.0 /100 | #335 | Tragic $44,010 |
| Immigrants | Cuba | 0.0 /100 | #336 | Tragic $43,461 |
| Menominee | 0.0 /100 | #337 | Tragic $42,581 |
| Crow | 0.0 /100 | #338 | Tragic $42,434 |
| Pima | 0.0 /100 | #339 | Tragic $42,357 |
| Navajo | 0.0 /100 | #340 | Tragic $42,098 |
| Hopi | 0.0 /100 | #341 | Tragic $42,060 |
| Arapaho | 0.0 /100 | #342 | Tragic $41,758 |
| Lumbee | 0.0 /100 | #343 | Tragic $41,715 |
| Pueblo | 0.0 /100 | #344 | Tragic $41,314 |
| Puerto Ricans | 0.0 /100 | #345 | Tragic $40,071 |
| Tohono O'odham | 0.0 /100 | #346 | Tragic $39,543 |
| Yup'ik | 0.0 /100 | #347 | Tragic $39,504 |
Demographics Similar to Immigrants from Korea by Median Male Earnings
In terms of median male earnings, the demographic groups most similar to Immigrants from Korea are Immigrants from Northern Europe ($64,987, a difference of 0.14%), Burmese ($65,236, a difference of 0.24%), Immigrants from Sweden ($65,406, a difference of 0.50%), Immigrants from Japan ($65,518, a difference of 0.67%), and Immigrants from Denmark ($64,625, a difference of 0.70%).
| Demographics | Rating | Rank | Median Male Earnings |
| Eastern Europeans | 100.0 /100 | #16 | Exceptional $66,472 |
| Immigrants | Belgium | 100.0 /100 | #17 | Exceptional $66,125 |
| Indians (Asian) | 100.0 /100 | #18 | Exceptional $66,078 |
| Cypriots | 100.0 /100 | #19 | Exceptional $65,549 |
| Immigrants | Japan | 100.0 /100 | #20 | Exceptional $65,518 |
| Immigrants | Sweden | 100.0 /100 | #21 | Exceptional $65,406 |
| Burmese | 100.0 /100 | #22 | Exceptional $65,236 |
| Immigrants | Korea | 100.0 /100 | #23 | Exceptional $65,079 |
| Immigrants | Northern Europe | 100.0 /100 | #24 | Exceptional $64,987 |
| Immigrants | Denmark | 100.0 /100 | #25 | Exceptional $64,625 |
| Turks | 100.0 /100 | #26 | Exceptional $64,253 |
| Immigrants | Switzerland | 100.0 /100 | #27 | Exceptional $63,944 |
| Russians | 100.0 /100 | #28 | Exceptional $63,939 |
| Asians | 100.0 /100 | #29 | Exceptional $63,827 |
| Immigrants | France | 100.0 /100 | #30 | Exceptional $63,715 |