Immigrants from South Eastern Asia vs Immigrants from Korea Median Male Earnings
COMPARE
Immigrants from South Eastern Asia
Immigrants from Korea
Median Male Earnings
Median Male Earnings Comparison
Immigrants from South Eastern Asia
Immigrants from Korea
$55,241
MEDIAN MALE EARNINGS
67.6/ 100
METRIC RATING
164th/ 347
METRIC RANK
$65,079
MEDIAN MALE EARNINGS
100.0/ 100
METRIC RATING
23rd/ 347
METRIC RANK
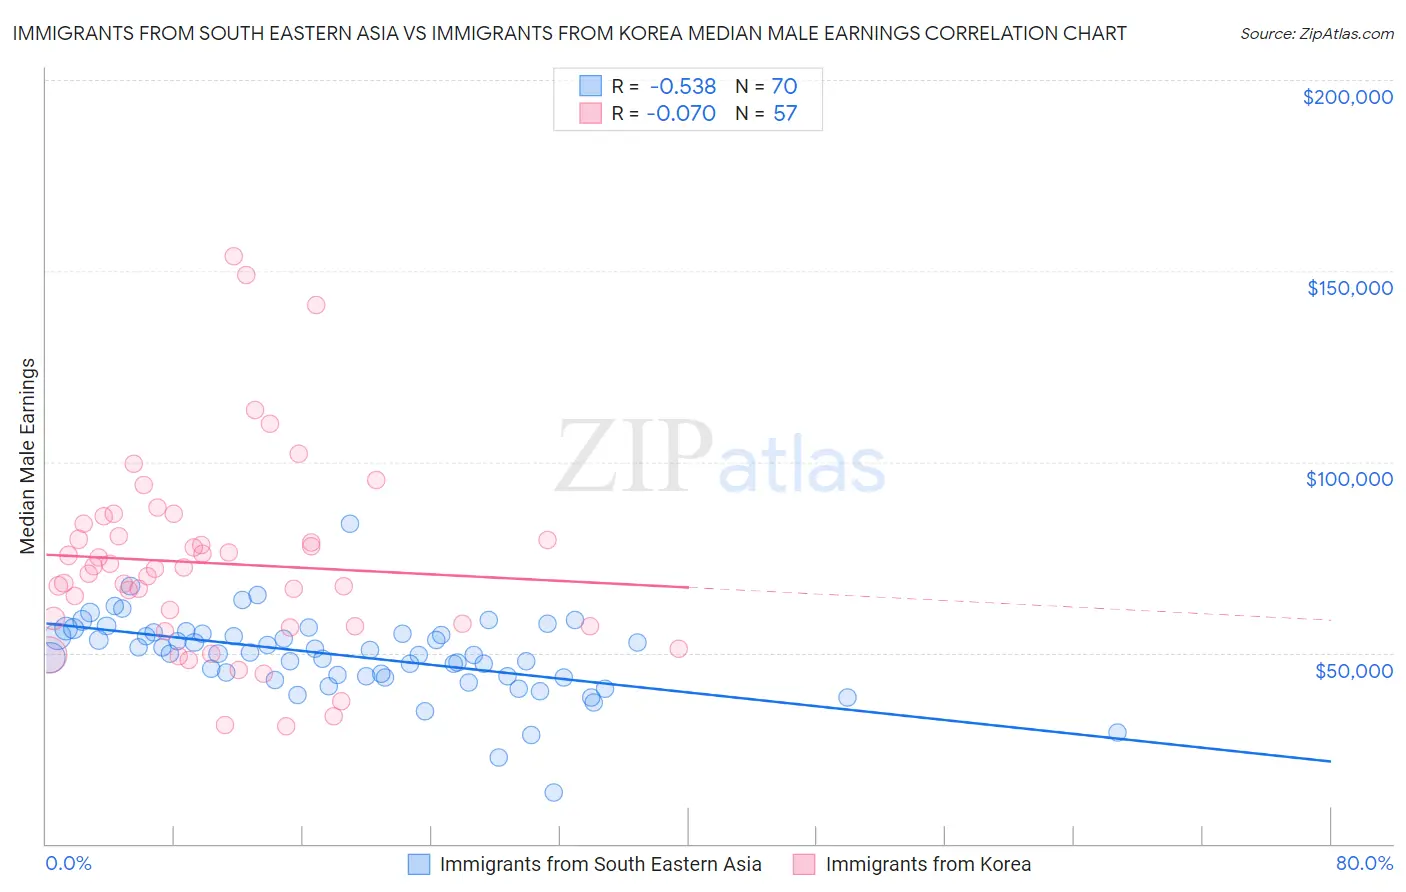
Immigrants from South Eastern Asia vs Immigrants from Korea Median Male Earnings Correlation Chart
The statistical analysis conducted on geographies consisting of 512,315,694 people shows a substantial negative correlation between the proportion of Immigrants from South Eastern Asia and median male earnings in the United States with a correlation coefficient (R) of -0.538 and weighted average of $55,241. Similarly, the statistical analysis conducted on geographies consisting of 416,203,155 people shows a slight negative correlation between the proportion of Immigrants from Korea and median male earnings in the United States with a correlation coefficient (R) of -0.070 and weighted average of $65,079, a difference of 17.8%.
Median Male Earnings Correlation Summary
| Measurement | Immigrants from South Eastern Asia | Immigrants from Korea |
| Minimum | $13,438 | $30,795 |
| Maximum | $83,902 | $153,870 |
| Range | $70,464 | $123,075 |
| Mean | $49,284 | $73,429 |
| Median | $49,995 | $71,921 |
| Interquartile 25% (IQ1) | $43,703 | $56,978 |
| Interquartile 75% (IQ3) | $54,970 | $82,188 |
| Interquartile Range (IQR) | $11,267 | $25,211 |
| Standard Deviation (Sample) | $10,432 | $25,444 |
| Standard Deviation (Population) | $10,357 | $25,220 |
Similar Demographics by Median Male Earnings
Demographics Similar to Immigrants from South Eastern Asia by Median Male Earnings
In terms of median male earnings, the demographic groups most similar to Immigrants from South Eastern Asia are Ugandan ($55,290, a difference of 0.090%), Immigrants from Portugal ($55,182, a difference of 0.11%), French ($55,350, a difference of 0.20%), Belgian ($55,361, a difference of 0.22%), and Basque ($55,370, a difference of 0.23%).
| Demographics | Rating | Rank | Median Male Earnings |
| Icelanders | 71.2 /100 | #157 | Good $55,415 |
| Czechoslovakians | 70.5 /100 | #158 | Good $55,382 |
| Alsatians | 70.5 /100 | #159 | Good $55,380 |
| Basques | 70.3 /100 | #160 | Good $55,370 |
| Belgians | 70.1 /100 | #161 | Good $55,361 |
| French | 69.9 /100 | #162 | Good $55,350 |
| Ugandans | 68.6 /100 | #163 | Good $55,290 |
| Immigrants | South Eastern Asia | 67.6 /100 | #164 | Good $55,241 |
| Immigrants | Portugal | 66.3 /100 | #165 | Good $55,182 |
| Germans | 61.6 /100 | #166 | Good $54,974 |
| Immigrants | Fiji | 61.2 /100 | #167 | Good $54,958 |
| Immigrants | Vietnam | 60.2 /100 | #168 | Good $54,913 |
| French Canadians | 55.6 /100 | #169 | Average $54,722 |
| Finns | 55.6 /100 | #170 | Average $54,721 |
| Immigrants | Peru | 54.9 /100 | #171 | Average $54,695 |
Demographics Similar to Immigrants from Korea by Median Male Earnings
In terms of median male earnings, the demographic groups most similar to Immigrants from Korea are Immigrants from Northern Europe ($64,987, a difference of 0.14%), Burmese ($65,236, a difference of 0.24%), Immigrants from Sweden ($65,406, a difference of 0.50%), Immigrants from Japan ($65,518, a difference of 0.67%), and Immigrants from Denmark ($64,625, a difference of 0.70%).
| Demographics | Rating | Rank | Median Male Earnings |
| Eastern Europeans | 100.0 /100 | #16 | Exceptional $66,472 |
| Immigrants | Belgium | 100.0 /100 | #17 | Exceptional $66,125 |
| Indians (Asian) | 100.0 /100 | #18 | Exceptional $66,078 |
| Cypriots | 100.0 /100 | #19 | Exceptional $65,549 |
| Immigrants | Japan | 100.0 /100 | #20 | Exceptional $65,518 |
| Immigrants | Sweden | 100.0 /100 | #21 | Exceptional $65,406 |
| Burmese | 100.0 /100 | #22 | Exceptional $65,236 |
| Immigrants | Korea | 100.0 /100 | #23 | Exceptional $65,079 |
| Immigrants | Northern Europe | 100.0 /100 | #24 | Exceptional $64,987 |
| Immigrants | Denmark | 100.0 /100 | #25 | Exceptional $64,625 |
| Turks | 100.0 /100 | #26 | Exceptional $64,253 |
| Immigrants | Switzerland | 100.0 /100 | #27 | Exceptional $63,944 |
| Russians | 100.0 /100 | #28 | Exceptional $63,939 |
| Asians | 100.0 /100 | #29 | Exceptional $63,827 |
| Immigrants | France | 100.0 /100 | #30 | Exceptional $63,715 |