Jamaican vs Immigrants from Argentina Median Male Earnings
COMPARE
Jamaican
Immigrants from Argentina
Median Male Earnings
Median Male Earnings Comparison
Jamaicans
Immigrants from Argentina
$48,632
MEDIAN MALE EARNINGS
0.3/ 100
METRIC RATING
273rd/ 347
METRIC RANK
$59,491
MEDIAN MALE EARNINGS
99.3/ 100
METRIC RATING
88th/ 347
METRIC RANK
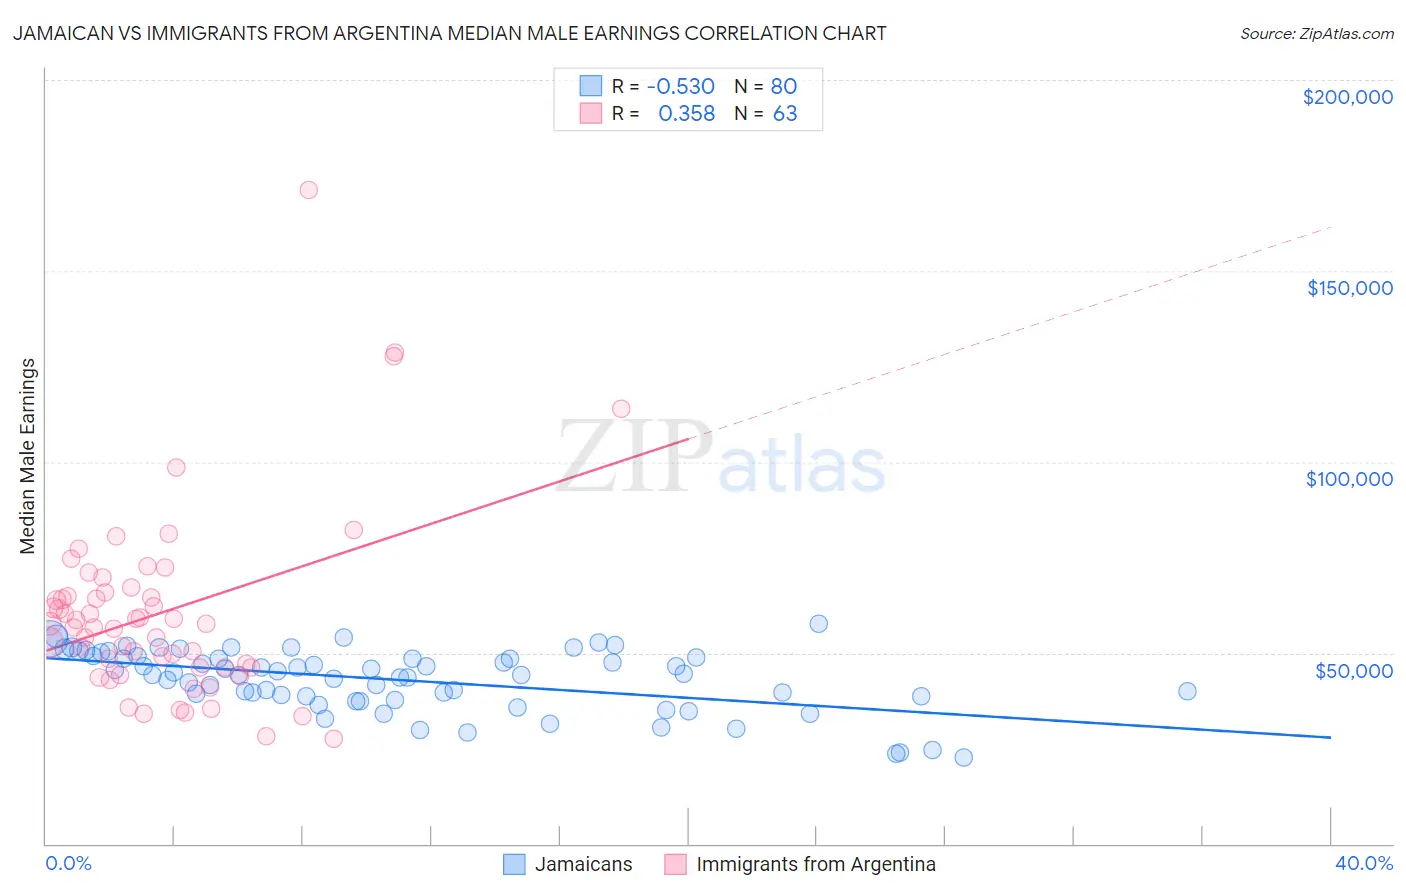
Jamaican vs Immigrants from Argentina Median Male Earnings Correlation Chart
The statistical analysis conducted on geographies consisting of 367,962,773 people shows a substantial negative correlation between the proportion of Jamaicans and median male earnings in the United States with a correlation coefficient (R) of -0.530 and weighted average of $48,632. Similarly, the statistical analysis conducted on geographies consisting of 264,393,462 people shows a mild positive correlation between the proportion of Immigrants from Argentina and median male earnings in the United States with a correlation coefficient (R) of 0.358 and weighted average of $59,491, a difference of 22.3%.
Median Male Earnings Correlation Summary
| Measurement | Jamaican | Immigrants from Argentina |
| Minimum | $22,747 | $27,639 |
| Maximum | $57,769 | $171,304 |
| Range | $35,022 | $143,665 |
| Mean | $42,945 | $60,629 |
| Median | $44,504 | $57,556 |
| Interquartile 25% (IQ1) | $38,662 | $46,111 |
| Interquartile 75% (IQ3) | $48,891 | $65,873 |
| Interquartile Range (IQR) | $10,229 | $19,762 |
| Standard Deviation (Sample) | $7,942 | $24,754 |
| Standard Deviation (Population) | $7,893 | $24,557 |
Similar Demographics by Median Male Earnings
Demographics Similar to Jamaicans by Median Male Earnings
In terms of median male earnings, the demographic groups most similar to Jamaicans are Salvadoran ($48,646, a difference of 0.030%), Cherokee ($48,669, a difference of 0.080%), Colville ($48,516, a difference of 0.24%), Potawatomi ($48,768, a difference of 0.28%), and Immigrants from Somalia ($48,439, a difference of 0.40%).
| Demographics | Rating | Rank | Median Male Earnings |
| Somalis | 0.5 /100 | #266 | Tragic $49,025 |
| Spanish Americans | 0.5 /100 | #267 | Tragic $49,008 |
| Ute | 0.4 /100 | #268 | Tragic $48,899 |
| Tsimshian | 0.4 /100 | #269 | Tragic $48,836 |
| Potawatomi | 0.4 /100 | #270 | Tragic $48,768 |
| Cherokee | 0.3 /100 | #271 | Tragic $48,669 |
| Salvadorans | 0.3 /100 | #272 | Tragic $48,646 |
| Jamaicans | 0.3 /100 | #273 | Tragic $48,632 |
| Colville | 0.3 /100 | #274 | Tragic $48,516 |
| Immigrants | Somalia | 0.3 /100 | #275 | Tragic $48,439 |
| Blackfeet | 0.3 /100 | #276 | Tragic $48,402 |
| Belizeans | 0.2 /100 | #277 | Tragic $48,358 |
| Immigrants | Liberia | 0.2 /100 | #278 | Tragic $48,317 |
| Hmong | 0.2 /100 | #279 | Tragic $48,254 |
| Comanche | 0.2 /100 | #280 | Tragic $48,202 |
Demographics Similar to Immigrants from Argentina by Median Male Earnings
In terms of median male earnings, the demographic groups most similar to Immigrants from Argentina are Macedonian ($59,522, a difference of 0.050%), Immigrants from England ($59,527, a difference of 0.060%), Italian ($59,551, a difference of 0.10%), Afghan ($59,554, a difference of 0.11%), and Immigrants from Moldova ($59,417, a difference of 0.12%).
| Demographics | Rating | Rank | Median Male Earnings |
| Ukrainians | 99.4 /100 | #81 | Exceptional $59,728 |
| Croatians | 99.4 /100 | #82 | Exceptional $59,715 |
| Immigrants | Italy | 99.4 /100 | #83 | Exceptional $59,691 |
| Afghans | 99.3 /100 | #84 | Exceptional $59,554 |
| Italians | 99.3 /100 | #85 | Exceptional $59,551 |
| Immigrants | England | 99.3 /100 | #86 | Exceptional $59,527 |
| Macedonians | 99.3 /100 | #87 | Exceptional $59,522 |
| Immigrants | Argentina | 99.3 /100 | #88 | Exceptional $59,491 |
| Immigrants | Moldova | 99.2 /100 | #89 | Exceptional $59,417 |
| Austrians | 99.2 /100 | #90 | Exceptional $59,359 |
| Laotians | 99.2 /100 | #91 | Exceptional $59,351 |
| Immigrants | Kazakhstan | 99.1 /100 | #92 | Exceptional $59,278 |
| Immigrants | Southern Europe | 99.0 /100 | #93 | Exceptional $59,217 |
| Immigrants | North Macedonia | 99.0 /100 | #94 | Exceptional $59,189 |
| Immigrants | Lebanon | 98.6 /100 | #95 | Exceptional $58,835 |