Cambodian vs Immigrants from Argentina 2 or more Vehicles in Household
COMPARE
Cambodian
Immigrants from Argentina
2 or more Vehicles in Household
2 or more Vehicles in Household Comparison
Cambodians
Immigrants from Argentina
53.3%
2 OR MORE VEHICLES IN HOUSEHOLD
2.3/ 100
METRIC RATING
239th/ 347
METRIC RANK
53.9%
2 OR MORE VEHICLES IN HOUSEHOLD
6.8/ 100
METRIC RATING
218th/ 347
METRIC RANK
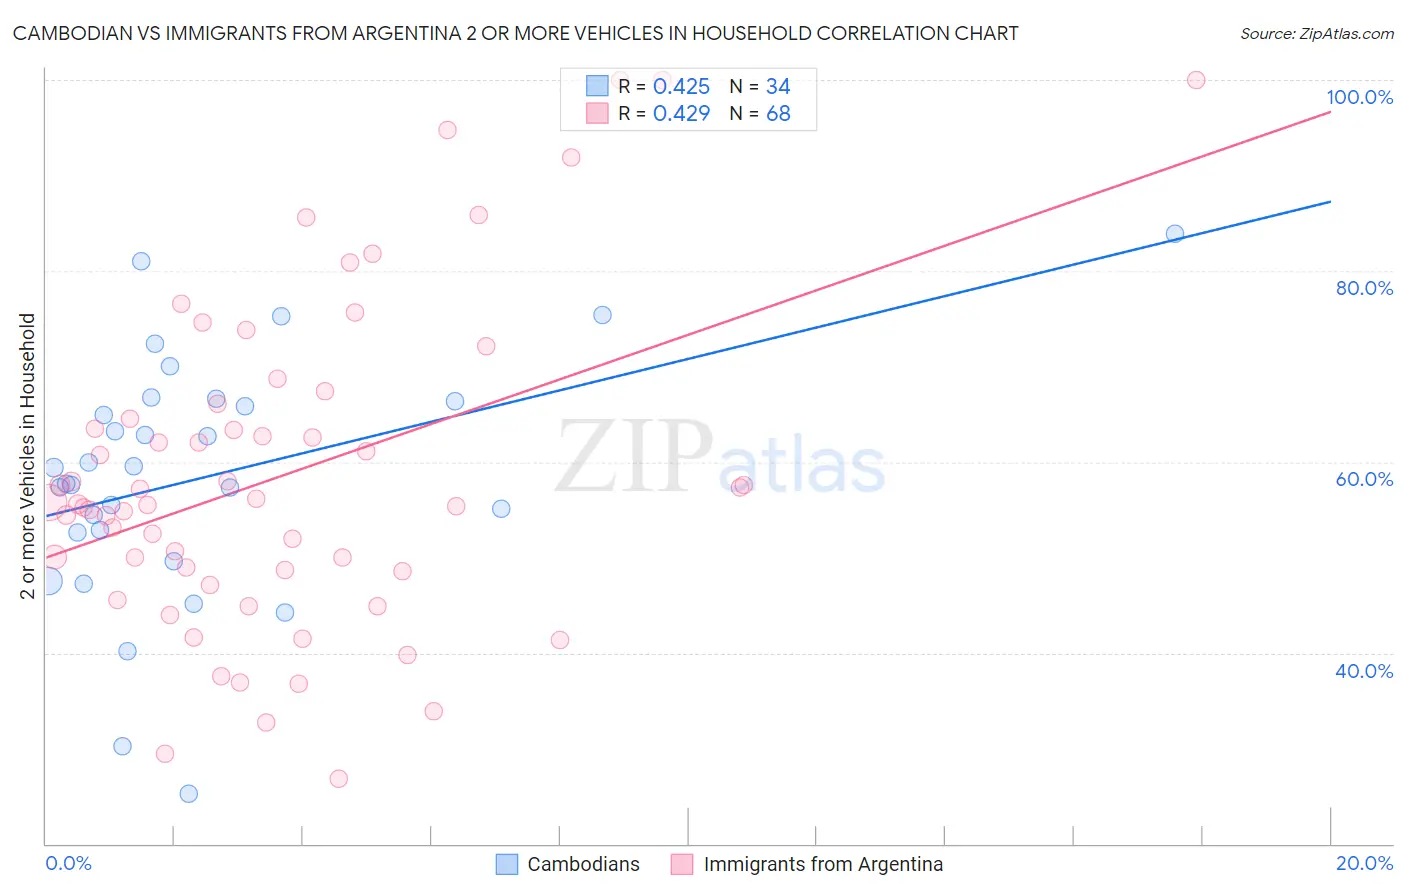
Cambodian vs Immigrants from Argentina 2 or more Vehicles in Household Correlation Chart
The statistical analysis conducted on geographies consisting of 102,491,174 people shows a moderate positive correlation between the proportion of Cambodians and percentage of households with 2 or more vehicles available in the United States with a correlation coefficient (R) of 0.425 and weighted average of 53.3%. Similarly, the statistical analysis conducted on geographies consisting of 264,362,205 people shows a moderate positive correlation between the proportion of Immigrants from Argentina and percentage of households with 2 or more vehicles available in the United States with a correlation coefficient (R) of 0.429 and weighted average of 53.9%, a difference of 1.2%.
2 or more Vehicles in Household Correlation Summary
| Measurement | Cambodian | Immigrants from Argentina |
| Minimum | 25.3% | 26.8% |
| Maximum | 83.9% | 100.0% |
| Range | 58.6% | 73.2% |
| Mean | 58.4% | 58.6% |
| Median | 58.6% | 55.6% |
| Interquartile 25% (IQ1) | 52.7% | 48.6% |
| Interquartile 75% (IQ3) | 66.4% | 65.3% |
| Interquartile Range (IQR) | 13.8% | 16.6% |
| Standard Deviation (Sample) | 12.9% | 16.9% |
| Standard Deviation (Population) | 12.7% | 16.8% |
Similar Demographics by 2 or more Vehicles in Household
Demographics Similar to Cambodians by 2 or more Vehicles in Household
In terms of 2 or more vehicles in household, the demographic groups most similar to Cambodians are Immigrants from Armenia (53.3%, a difference of 0.010%), Macedonian (53.3%, a difference of 0.070%), Immigrants from Europe (53.2%, a difference of 0.070%), Immigrants from Sierra Leone (53.2%, a difference of 0.10%), and Immigrants from Eastern Asia (53.2%, a difference of 0.10%).
| Demographics | Rating | Rank | 2 or more Vehicles in Household |
| Immigrants | Guatemala | 3.2 /100 | #232 | Tragic 53.5% |
| Ugandans | 3.2 /100 | #233 | Tragic 53.5% |
| Immigrants | Switzerland | 3.0 /100 | #234 | Tragic 53.4% |
| Immigrants | Middle Africa | 3.0 /100 | #235 | Tragic 53.4% |
| Indonesians | 2.7 /100 | #236 | Tragic 53.4% |
| Macedonians | 2.4 /100 | #237 | Tragic 53.3% |
| Immigrants | Armenia | 2.3 /100 | #238 | Tragic 53.3% |
| Cambodians | 2.3 /100 | #239 | Tragic 53.3% |
| Immigrants | Europe | 2.1 /100 | #240 | Tragic 53.2% |
| Immigrants | Sierra Leone | 2.1 /100 | #241 | Tragic 53.2% |
| Immigrants | Eastern Asia | 2.1 /100 | #242 | Tragic 53.2% |
| Ethiopians | 1.7 /100 | #243 | Tragic 53.1% |
| Indians (Asian) | 1.7 /100 | #244 | Tragic 53.1% |
| Immigrants | Ethiopia | 1.5 /100 | #245 | Tragic 53.0% |
| Immigrants | Nigeria | 1.2 /100 | #246 | Tragic 52.9% |
Demographics Similar to Immigrants from Argentina by 2 or more Vehicles in Household
In terms of 2 or more vehicles in household, the demographic groups most similar to Immigrants from Argentina are Immigrants from Burma/Myanmar (53.9%, a difference of 0.050%), South American Indian (53.9%, a difference of 0.060%), Taiwanese (53.9%, a difference of 0.080%), Immigrants from Singapore (53.9%, a difference of 0.10%), and Kiowa (53.9%, a difference of 0.11%).
| Demographics | Rating | Rank | 2 or more Vehicles in Household |
| Immigrants | Hungary | 11.3 /100 | #211 | Poor 54.2% |
| Immigrants | Chile | 11.1 /100 | #212 | Poor 54.2% |
| Guatemalans | 9.6 /100 | #213 | Tragic 54.1% |
| Immigrants | Czechoslovakia | 9.4 /100 | #214 | Tragic 54.1% |
| Aleuts | 9.3 /100 | #215 | Tragic 54.1% |
| Immigrants | Western Asia | 9.3 /100 | #216 | Tragic 54.1% |
| Immigrants | Burma/Myanmar | 7.1 /100 | #217 | Tragic 53.9% |
| Immigrants | Argentina | 6.8 /100 | #218 | Tragic 53.9% |
| South American Indians | 6.5 /100 | #219 | Tragic 53.9% |
| Taiwanese | 6.3 /100 | #220 | Tragic 53.9% |
| Immigrants | Singapore | 6.3 /100 | #221 | Tragic 53.9% |
| Kiowa | 6.2 /100 | #222 | Tragic 53.9% |
| Immigrants | Bosnia and Herzegovina | 5.5 /100 | #223 | Tragic 53.8% |
| Brazilians | 5.3 /100 | #224 | Tragic 53.8% |
| Immigrants | Egypt | 5.2 /100 | #225 | Tragic 53.8% |