Cambodian vs Immigrants from Argentina Male Poverty
COMPARE
Cambodian
Immigrants from Argentina
Male Poverty
Male Poverty Comparison
Cambodians
Immigrants from Argentina
10.4%
MALE POVERTY
95.0/ 100
METRIC RATING
88th/ 347
METRIC RANK
10.6%
MALE POVERTY
89.8/ 100
METRIC RATING
111th/ 347
METRIC RANK
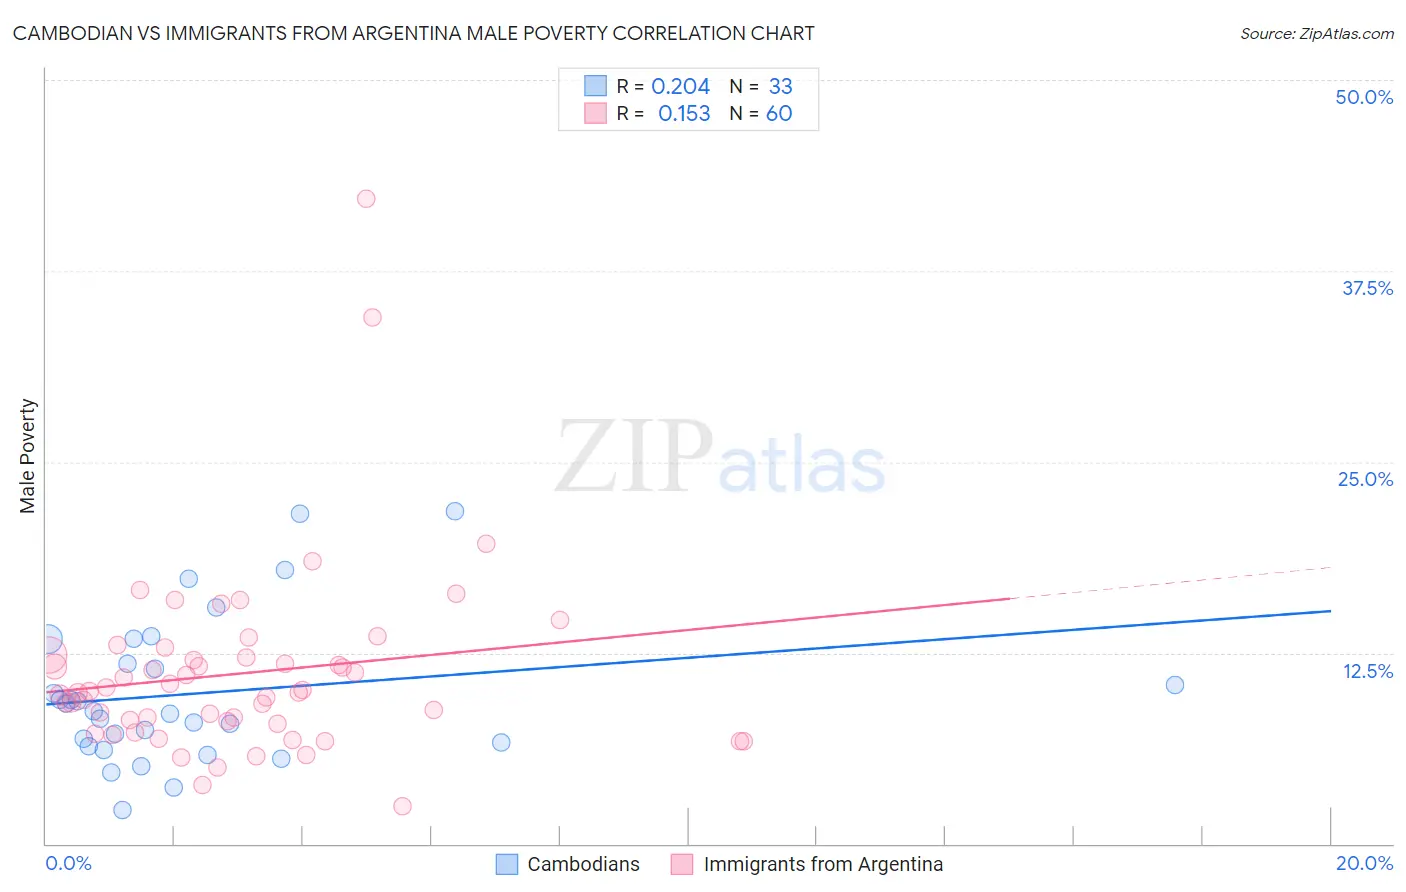
Cambodian vs Immigrants from Argentina Male Poverty Correlation Chart
The statistical analysis conducted on geographies consisting of 102,467,050 people shows a weak positive correlation between the proportion of Cambodians and poverty level among males in the United States with a correlation coefficient (R) of 0.204 and weighted average of 10.4%. Similarly, the statistical analysis conducted on geographies consisting of 264,308,619 people shows a poor positive correlation between the proportion of Immigrants from Argentina and poverty level among males in the United States with a correlation coefficient (R) of 0.153 and weighted average of 10.6%, a difference of 2.0%.
Male Poverty Correlation Summary
| Measurement | Cambodian | Immigrants from Argentina |
| Minimum | 2.2% | 2.5% |
| Maximum | 21.8% | 42.3% |
| Range | 19.6% | 39.8% |
| Mean | 9.8% | 11.2% |
| Median | 8.7% | 9.9% |
| Interquartile 25% (IQ1) | 6.5% | 7.9% |
| Interquartile 75% (IQ3) | 12.6% | 12.3% |
| Interquartile Range (IQR) | 6.1% | 4.4% |
| Standard Deviation (Sample) | 4.8% | 6.2% |
| Standard Deviation (Population) | 4.7% | 6.2% |
Similar Demographics by Male Poverty
Demographics Similar to Cambodians by Male Poverty
In terms of male poverty, the demographic groups most similar to Cambodians are Immigrants from Denmark (10.4%, a difference of 0.0%), Indian (Asian) (10.4%, a difference of 0.030%), British (10.4%, a difference of 0.10%), Northern European (10.4%, a difference of 0.14%), and Immigrants from Eastern Asia (10.4%, a difference of 0.18%).
| Demographics | Rating | Rank | Male Poverty |
| Belgians | 95.9 /100 | #81 | Exceptional 10.3% |
| Egyptians | 95.9 /100 | #82 | Exceptional 10.3% |
| Immigrants | Sweden | 95.7 /100 | #83 | Exceptional 10.3% |
| Czechoslovakians | 95.6 /100 | #84 | Exceptional 10.3% |
| Immigrants | England | 95.5 /100 | #85 | Exceptional 10.4% |
| Immigrants | Eastern Asia | 95.3 /100 | #86 | Exceptional 10.4% |
| Northern Europeans | 95.2 /100 | #87 | Exceptional 10.4% |
| Cambodians | 95.0 /100 | #88 | Exceptional 10.4% |
| Immigrants | Denmark | 95.0 /100 | #89 | Exceptional 10.4% |
| Indians (Asian) | 94.9 /100 | #90 | Exceptional 10.4% |
| British | 94.8 /100 | #91 | Exceptional 10.4% |
| Jordanians | 94.4 /100 | #92 | Exceptional 10.4% |
| Australians | 94.4 /100 | #93 | Exceptional 10.4% |
| Immigrants | South Africa | 94.1 /100 | #94 | Exceptional 10.4% |
| Scottish | 94.0 /100 | #95 | Exceptional 10.4% |
Demographics Similar to Immigrants from Argentina by Male Poverty
In terms of male poverty, the demographic groups most similar to Immigrants from Argentina are Immigrants from Turkey (10.6%, a difference of 0.080%), Argentinean (10.6%, a difference of 0.11%), Palestinian (10.6%, a difference of 0.18%), Immigrants from Brazil (10.6%, a difference of 0.20%), and Albanian (10.6%, a difference of 0.24%).
| Demographics | Rating | Rank | Male Poverty |
| Welsh | 91.6 /100 | #104 | Exceptional 10.5% |
| Canadians | 91.6 /100 | #105 | Exceptional 10.5% |
| Immigrants | Southern Europe | 91.3 /100 | #106 | Exceptional 10.5% |
| Laotians | 91.2 /100 | #107 | Exceptional 10.5% |
| Portuguese | 91.0 /100 | #108 | Exceptional 10.6% |
| Albanians | 90.6 /100 | #109 | Exceptional 10.6% |
| Argentineans | 90.1 /100 | #110 | Exceptional 10.6% |
| Immigrants | Argentina | 89.8 /100 | #111 | Excellent 10.6% |
| Immigrants | Turkey | 89.5 /100 | #112 | Excellent 10.6% |
| Palestinians | 89.1 /100 | #113 | Excellent 10.6% |
| Immigrants | Brazil | 89.0 /100 | #114 | Excellent 10.6% |
| Immigrants | Russia | 88.6 /100 | #115 | Excellent 10.6% |
| Sri Lankans | 88.1 /100 | #116 | Excellent 10.6% |
| Immigrants | South Eastern Asia | 88.1 /100 | #117 | Excellent 10.6% |
| Okinawans | 87.6 /100 | #118 | Excellent 10.7% |