Albanian vs Dominican Median Male Earnings
COMPARE
Albanian
Dominican
Median Male Earnings
Median Male Earnings Comparison
Albanians
Dominicans
$58,680
MEDIAN MALE EARNINGS
98.4/ 100
METRIC RATING
96th/ 347
METRIC RANK
$47,204
MEDIAN MALE EARNINGS
0.1/ 100
METRIC RATING
297th/ 347
METRIC RANK
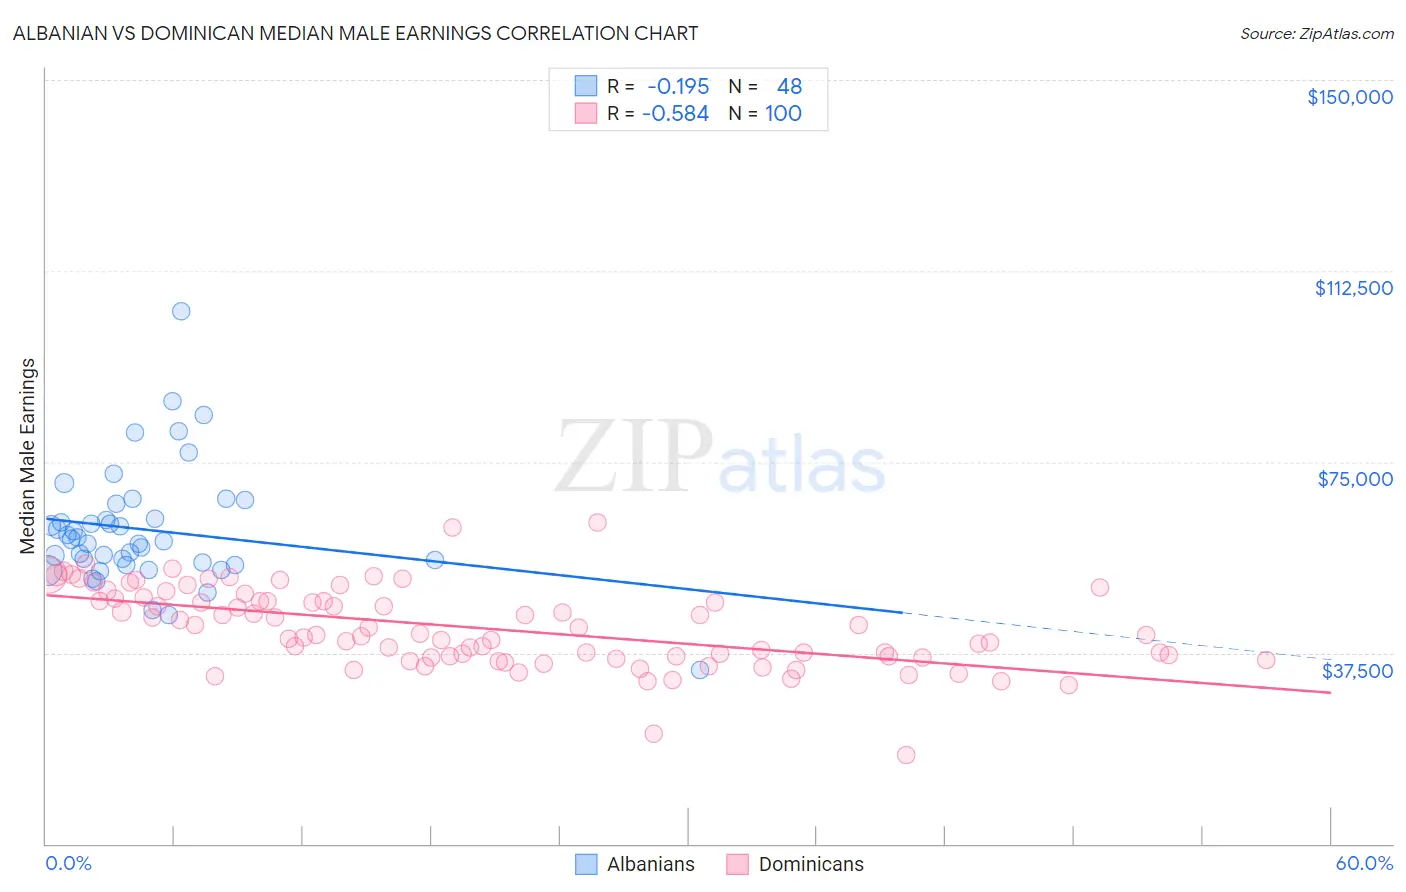
Albanian vs Dominican Median Male Earnings Correlation Chart
The statistical analysis conducted on geographies consisting of 193,234,421 people shows a poor negative correlation between the proportion of Albanians and median male earnings in the United States with a correlation coefficient (R) of -0.195 and weighted average of $58,680. Similarly, the statistical analysis conducted on geographies consisting of 355,000,212 people shows a substantial negative correlation between the proportion of Dominicans and median male earnings in the United States with a correlation coefficient (R) of -0.584 and weighted average of $47,204, a difference of 24.3%.
Median Male Earnings Correlation Summary
| Measurement | Albanian | Dominican |
| Minimum | $34,079 | $17,436 |
| Maximum | $104,479 | $62,989 |
| Range | $70,400 | $45,553 |
| Mean | $61,666 | $42,393 |
| Median | $59,610 | $41,223 |
| Interquartile 25% (IQ1) | $54,972 | $36,717 |
| Interquartile 75% (IQ3) | $65,262 | $47,976 |
| Interquartile Range (IQR) | $10,290 | $11,259 |
| Standard Deviation (Sample) | $11,807 | $7,882 |
| Standard Deviation (Population) | $11,684 | $7,843 |
Similar Demographics by Median Male Earnings
Demographics Similar to Albanians by Median Male Earnings
In terms of median male earnings, the demographic groups most similar to Albanians are Northern European ($58,588, a difference of 0.16%), Immigrants from Lebanon ($58,835, a difference of 0.27%), Jordanian ($58,500, a difference of 0.31%), Immigrants from Poland ($58,452, a difference of 0.39%), and Assyrian/Chaldean/Syriac ($58,437, a difference of 0.42%).
| Demographics | Rating | Rank | Median Male Earnings |
| Immigrants | Moldova | 99.2 /100 | #89 | Exceptional $59,417 |
| Austrians | 99.2 /100 | #90 | Exceptional $59,359 |
| Laotians | 99.2 /100 | #91 | Exceptional $59,351 |
| Immigrants | Kazakhstan | 99.1 /100 | #92 | Exceptional $59,278 |
| Immigrants | Southern Europe | 99.0 /100 | #93 | Exceptional $59,217 |
| Immigrants | North Macedonia | 99.0 /100 | #94 | Exceptional $59,189 |
| Immigrants | Lebanon | 98.6 /100 | #95 | Exceptional $58,835 |
| Albanians | 98.4 /100 | #96 | Exceptional $58,680 |
| Northern Europeans | 98.2 /100 | #97 | Exceptional $58,588 |
| Jordanians | 98.1 /100 | #98 | Exceptional $58,500 |
| Immigrants | Poland | 98.0 /100 | #99 | Exceptional $58,452 |
| Assyrians/Chaldeans/Syriacs | 97.9 /100 | #100 | Exceptional $58,437 |
| Immigrants | Brazil | 97.7 /100 | #101 | Exceptional $58,324 |
| Syrians | 97.4 /100 | #102 | Exceptional $58,187 |
| Poles | 97.3 /100 | #103 | Exceptional $58,139 |
Demographics Similar to Dominicans by Median Male Earnings
In terms of median male earnings, the demographic groups most similar to Dominicans are Immigrants from Micronesia ($47,177, a difference of 0.060%), Inupiat ($47,281, a difference of 0.16%), Immigrants from Zaire ($47,070, a difference of 0.28%), U.S. Virgin Islander ($47,066, a difference of 0.29%), and Central American Indian ($47,433, a difference of 0.48%).
| Demographics | Rating | Rank | Median Male Earnings |
| Immigrants | Belize | 0.1 /100 | #290 | Tragic $47,809 |
| Choctaw | 0.1 /100 | #291 | Tragic $47,729 |
| Immigrants | Dominica | 0.1 /100 | #292 | Tragic $47,651 |
| Indonesians | 0.1 /100 | #293 | Tragic $47,503 |
| Immigrants | Nicaragua | 0.1 /100 | #294 | Tragic $47,482 |
| Central American Indians | 0.1 /100 | #295 | Tragic $47,433 |
| Inupiat | 0.1 /100 | #296 | Tragic $47,281 |
| Dominicans | 0.1 /100 | #297 | Tragic $47,204 |
| Immigrants | Micronesia | 0.1 /100 | #298 | Tragic $47,177 |
| Immigrants | Zaire | 0.1 /100 | #299 | Tragic $47,070 |
| U.S. Virgin Islanders | 0.1 /100 | #300 | Tragic $47,066 |
| Immigrants | Latin America | 0.1 /100 | #301 | Tragic $46,941 |
| Seminole | 0.1 /100 | #302 | Tragic $46,783 |
| Yaqui | 0.1 /100 | #303 | Tragic $46,777 |
| Bangladeshis | 0.1 /100 | #304 | Tragic $46,744 |