Immigrants from Guatemala vs Dominican Median Male Earnings
COMPARE
Immigrants from Guatemala
Dominican
Median Male Earnings
Median Male Earnings Comparison
Immigrants from Guatemala
Dominicans
$46,244
MEDIAN MALE EARNINGS
0.0/ 100
METRIC RATING
315th/ 347
METRIC RANK
$47,204
MEDIAN MALE EARNINGS
0.1/ 100
METRIC RATING
297th/ 347
METRIC RANK
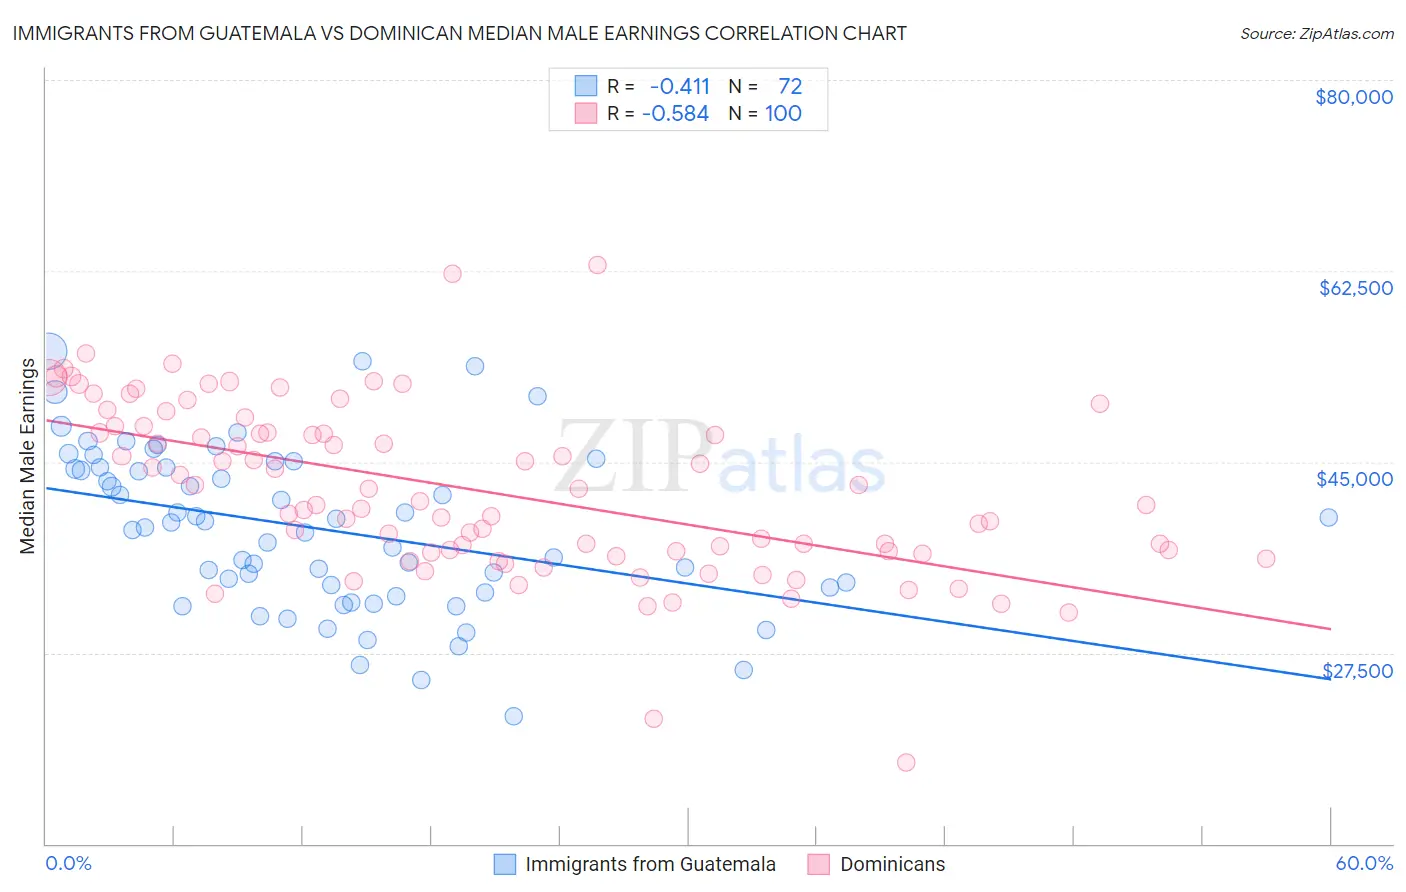
Immigrants from Guatemala vs Dominican Median Male Earnings Correlation Chart
The statistical analysis conducted on geographies consisting of 377,185,627 people shows a moderate negative correlation between the proportion of Immigrants from Guatemala and median male earnings in the United States with a correlation coefficient (R) of -0.411 and weighted average of $46,244. Similarly, the statistical analysis conducted on geographies consisting of 355,000,212 people shows a substantial negative correlation between the proportion of Dominicans and median male earnings in the United States with a correlation coefficient (R) of -0.584 and weighted average of $47,204, a difference of 2.1%.
Median Male Earnings Correlation Summary
| Measurement | Immigrants from Guatemala | Dominican |
| Minimum | $21,641 | $17,436 |
| Maximum | $55,102 | $62,989 |
| Range | $33,461 | $45,553 |
| Mean | $38,841 | $42,393 |
| Median | $39,223 | $41,223 |
| Interquartile 25% (IQ1) | $33,223 | $36,717 |
| Interquartile 75% (IQ3) | $44,533 | $47,976 |
| Interquartile Range (IQR) | $11,310 | $11,259 |
| Standard Deviation (Sample) | $7,423 | $7,882 |
| Standard Deviation (Population) | $7,371 | $7,843 |
Demographics Similar to Immigrants from Guatemala and Dominicans by Median Male Earnings
In terms of median male earnings, the demographic groups most similar to Immigrants from Guatemala are Immigrants from Caribbean ($46,193, a difference of 0.11%), Chippewa ($46,368, a difference of 0.27%), Honduran ($46,374, a difference of 0.28%), Hispanic or Latino ($46,419, a difference of 0.38%), and Apache ($46,429, a difference of 0.40%). Similarly, the demographic groups most similar to Dominicans are Immigrants from Micronesia ($47,177, a difference of 0.060%), Inupiat ($47,281, a difference of 0.16%), Immigrants from Zaire ($47,070, a difference of 0.28%), U.S. Virgin Islander ($47,066, a difference of 0.29%), and Immigrants from Latin America ($46,941, a difference of 0.56%).
| Demographics | Rating | Rank | Median Male Earnings |
| Inupiat | 0.1 /100 | #296 | Tragic $47,281 |
| Dominicans | 0.1 /100 | #297 | Tragic $47,204 |
| Immigrants | Micronesia | 0.1 /100 | #298 | Tragic $47,177 |
| Immigrants | Zaire | 0.1 /100 | #299 | Tragic $47,070 |
| U.S. Virgin Islanders | 0.1 /100 | #300 | Tragic $47,066 |
| Immigrants | Latin America | 0.1 /100 | #301 | Tragic $46,941 |
| Seminole | 0.1 /100 | #302 | Tragic $46,783 |
| Yaqui | 0.1 /100 | #303 | Tragic $46,777 |
| Bangladeshis | 0.1 /100 | #304 | Tragic $46,744 |
| Guatemalans | 0.0 /100 | #305 | Tragic $46,736 |
| Dutch West Indians | 0.0 /100 | #306 | Tragic $46,656 |
| Immigrants | Dominican Republic | 0.0 /100 | #307 | Tragic $46,655 |
| Ottawa | 0.0 /100 | #308 | Tragic $46,611 |
| Creek | 0.0 /100 | #309 | Tragic $46,594 |
| Cubans | 0.0 /100 | #310 | Tragic $46,580 |
| Apache | 0.0 /100 | #311 | Tragic $46,429 |
| Hispanics or Latinos | 0.0 /100 | #312 | Tragic $46,419 |
| Hondurans | 0.0 /100 | #313 | Tragic $46,374 |
| Chippewa | 0.0 /100 | #314 | Tragic $46,368 |
| Immigrants | Guatemala | 0.0 /100 | #315 | Tragic $46,244 |
| Immigrants | Caribbean | 0.0 /100 | #316 | Tragic $46,193 |