Malaysian vs Dominican Median Male Earnings
COMPARE
Malaysian
Dominican
Median Male Earnings
Median Male Earnings Comparison
Malaysians
Dominicans
$50,772
MEDIAN MALE EARNINGS
2.5/ 100
METRIC RATING
238th/ 347
METRIC RANK
$47,204
MEDIAN MALE EARNINGS
0.1/ 100
METRIC RATING
297th/ 347
METRIC RANK
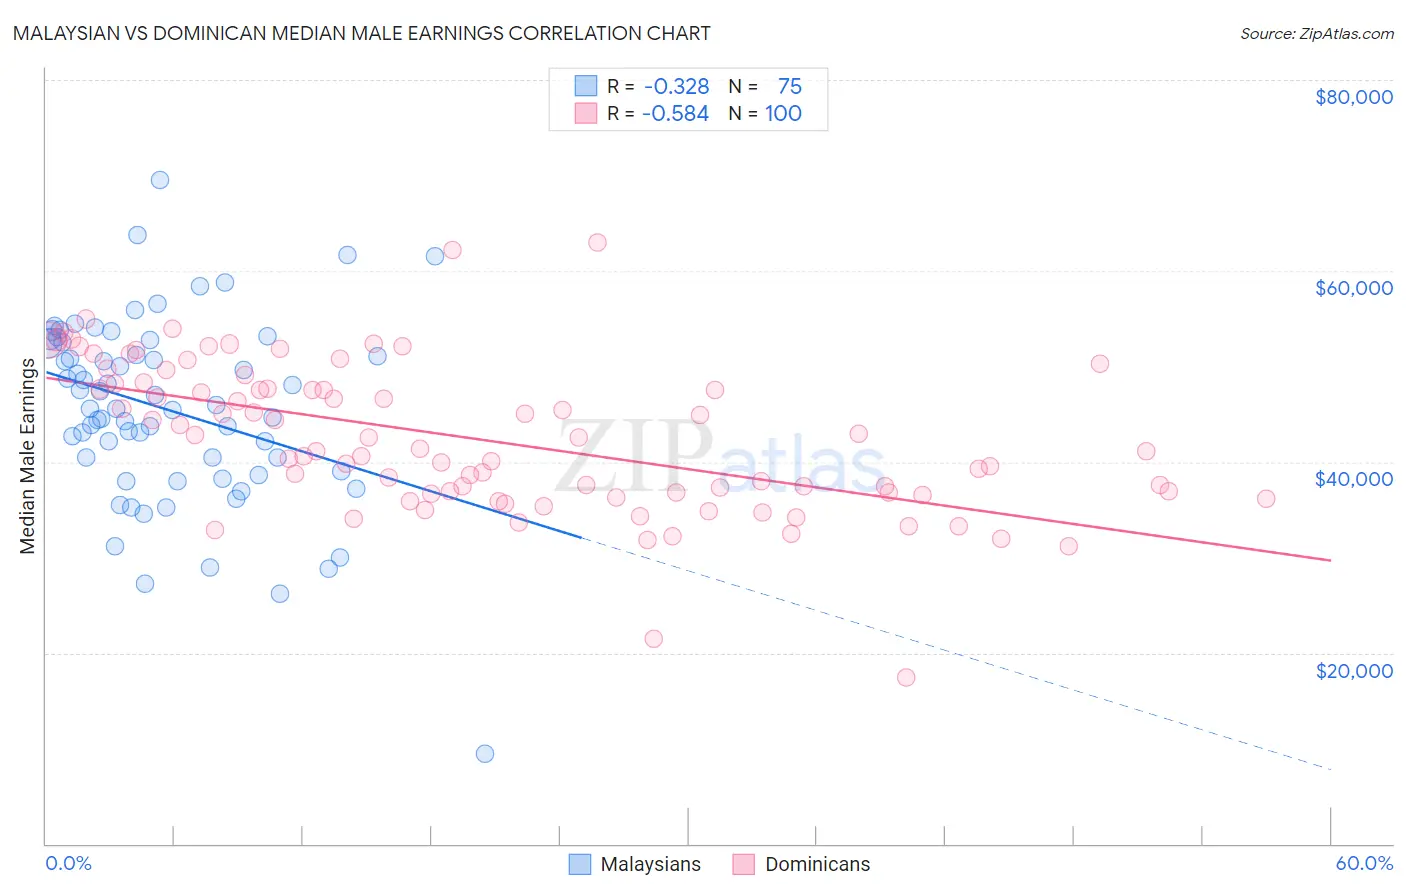
Malaysian vs Dominican Median Male Earnings Correlation Chart
The statistical analysis conducted on geographies consisting of 226,097,760 people shows a mild negative correlation between the proportion of Malaysians and median male earnings in the United States with a correlation coefficient (R) of -0.328 and weighted average of $50,772. Similarly, the statistical analysis conducted on geographies consisting of 355,000,212 people shows a substantial negative correlation between the proportion of Dominicans and median male earnings in the United States with a correlation coefficient (R) of -0.584 and weighted average of $47,204, a difference of 7.6%.
Median Male Earnings Correlation Summary
| Measurement | Malaysian | Dominican |
| Minimum | $9,476 | $17,436 |
| Maximum | $69,480 | $62,989 |
| Range | $60,004 | $45,553 |
| Mean | $45,460 | $42,393 |
| Median | $45,623 | $41,223 |
| Interquartile 25% (IQ1) | $39,010 | $36,717 |
| Interquartile 75% (IQ3) | $52,552 | $47,976 |
| Interquartile Range (IQR) | $13,542 | $11,259 |
| Standard Deviation (Sample) | $9,782 | $7,882 |
| Standard Deviation (Population) | $9,717 | $7,843 |
Similar Demographics by Median Male Earnings
Demographics Similar to Malaysians by Median Male Earnings
In terms of median male earnings, the demographic groups most similar to Malaysians are American ($50,761, a difference of 0.020%), Immigrants from Barbados ($50,795, a difference of 0.050%), West Indian ($50,682, a difference of 0.18%), Pennsylvania German ($50,878, a difference of 0.21%), and Immigrants from St. Vincent and the Grenadines ($50,665, a difference of 0.21%).
| Demographics | Rating | Rank | Median Male Earnings |
| Barbadians | 3.9 /100 | #231 | Tragic $51,236 |
| Sudanese | 3.9 /100 | #232 | Tragic $51,216 |
| Aleuts | 3.7 /100 | #233 | Tragic $51,168 |
| Cape Verdeans | 3.5 /100 | #234 | Tragic $51,103 |
| Immigrants | Western Africa | 3.0 /100 | #235 | Tragic $50,940 |
| Pennsylvania Germans | 2.8 /100 | #236 | Tragic $50,878 |
| Immigrants | Barbados | 2.6 /100 | #237 | Tragic $50,795 |
| Malaysians | 2.5 /100 | #238 | Tragic $50,772 |
| Americans | 2.5 /100 | #239 | Tragic $50,761 |
| West Indians | 2.3 /100 | #240 | Tragic $50,682 |
| Immigrants | St. Vincent and the Grenadines | 2.3 /100 | #241 | Tragic $50,665 |
| Guyanese | 2.2 /100 | #242 | Tragic $50,613 |
| French American Indians | 2.2 /100 | #243 | Tragic $50,611 |
| Houma | 2.0 /100 | #244 | Tragic $50,547 |
| Hawaiians | 1.9 /100 | #245 | Tragic $50,488 |
Demographics Similar to Dominicans by Median Male Earnings
In terms of median male earnings, the demographic groups most similar to Dominicans are Immigrants from Micronesia ($47,177, a difference of 0.060%), Inupiat ($47,281, a difference of 0.16%), Immigrants from Zaire ($47,070, a difference of 0.28%), U.S. Virgin Islander ($47,066, a difference of 0.29%), and Central American Indian ($47,433, a difference of 0.48%).
| Demographics | Rating | Rank | Median Male Earnings |
| Immigrants | Belize | 0.1 /100 | #290 | Tragic $47,809 |
| Choctaw | 0.1 /100 | #291 | Tragic $47,729 |
| Immigrants | Dominica | 0.1 /100 | #292 | Tragic $47,651 |
| Indonesians | 0.1 /100 | #293 | Tragic $47,503 |
| Immigrants | Nicaragua | 0.1 /100 | #294 | Tragic $47,482 |
| Central American Indians | 0.1 /100 | #295 | Tragic $47,433 |
| Inupiat | 0.1 /100 | #296 | Tragic $47,281 |
| Dominicans | 0.1 /100 | #297 | Tragic $47,204 |
| Immigrants | Micronesia | 0.1 /100 | #298 | Tragic $47,177 |
| Immigrants | Zaire | 0.1 /100 | #299 | Tragic $47,070 |
| U.S. Virgin Islanders | 0.1 /100 | #300 | Tragic $47,066 |
| Immigrants | Latin America | 0.1 /100 | #301 | Tragic $46,941 |
| Seminole | 0.1 /100 | #302 | Tragic $46,783 |
| Yaqui | 0.1 /100 | #303 | Tragic $46,777 |
| Bangladeshis | 0.1 /100 | #304 | Tragic $46,744 |