Cajun vs Salvadoran Median Female Earnings
COMPARE
Cajun
Salvadoran
Median Female Earnings
Median Female Earnings Comparison
Cajuns
Salvadorans
$34,034
MEDIAN FEMALE EARNINGS
0.0/ 100
METRIC RATING
327th/ 347
METRIC RANK
$37,083
MEDIAN FEMALE EARNINGS
0.4/ 100
METRIC RATING
264th/ 347
METRIC RANK
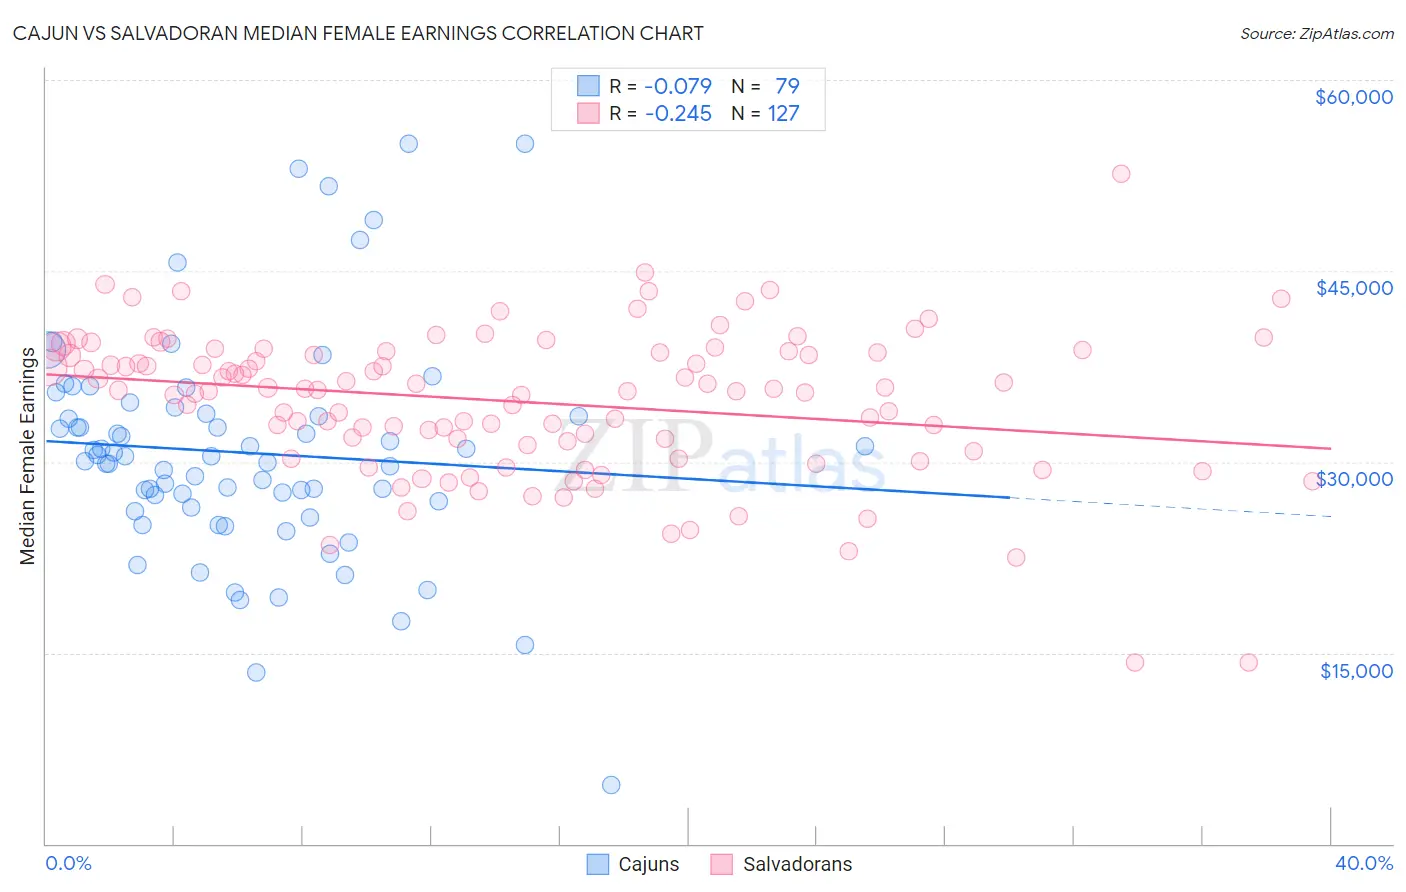
Cajun vs Salvadoran Median Female Earnings Correlation Chart
The statistical analysis conducted on geographies consisting of 149,646,456 people shows a slight negative correlation between the proportion of Cajuns and median female earnings in the United States with a correlation coefficient (R) of -0.079 and weighted average of $34,034. Similarly, the statistical analysis conducted on geographies consisting of 398,898,517 people shows a weak negative correlation between the proportion of Salvadorans and median female earnings in the United States with a correlation coefficient (R) of -0.245 and weighted average of $37,083, a difference of 9.0%.
Median Female Earnings Correlation Summary
| Measurement | Cajun | Salvadoran |
| Minimum | $4,615 | $14,245 |
| Maximum | $55,000 | $52,604 |
| Range | $50,385 | $38,359 |
| Mean | $30,723 | $34,711 |
| Median | $30,456 | $35,673 |
| Interquartile 25% (IQ1) | $26,402 | $31,372 |
| Interquartile 75% (IQ3) | $33,785 | $38,695 |
| Interquartile Range (IQR) | $7,382 | $7,323 |
| Standard Deviation (Sample) | $8,808 | $5,811 |
| Standard Deviation (Population) | $8,752 | $5,788 |
Similar Demographics by Median Female Earnings
Demographics Similar to Cajuns by Median Female Earnings
In terms of median female earnings, the demographic groups most similar to Cajuns are Kiowa ($34,074, a difference of 0.12%), Dutch West Indian ($34,106, a difference of 0.21%), Immigrants from Central America ($33,953, a difference of 0.24%), Hopi ($33,932, a difference of 0.30%), and Menominee ($33,894, a difference of 0.41%).
| Demographics | Rating | Rank | Median Female Earnings |
| Immigrants | Honduras | 0.0 /100 | #320 | Tragic $34,647 |
| Hispanics or Latinos | 0.0 /100 | #321 | Tragic $34,421 |
| Chickasaw | 0.0 /100 | #322 | Tragic $34,414 |
| Seminole | 0.0 /100 | #323 | Tragic $34,385 |
| Immigrants | Congo | 0.0 /100 | #324 | Tragic $34,317 |
| Dutch West Indians | 0.0 /100 | #325 | Tragic $34,106 |
| Kiowa | 0.0 /100 | #326 | Tragic $34,074 |
| Cajuns | 0.0 /100 | #327 | Tragic $34,034 |
| Immigrants | Central America | 0.0 /100 | #328 | Tragic $33,953 |
| Hopi | 0.0 /100 | #329 | Tragic $33,932 |
| Menominee | 0.0 /100 | #330 | Tragic $33,894 |
| Natives/Alaskans | 0.0 /100 | #331 | Tragic $33,806 |
| Choctaw | 0.0 /100 | #332 | Tragic $33,775 |
| Mexicans | 0.0 /100 | #333 | Tragic $33,664 |
| Spanish American Indians | 0.0 /100 | #334 | Tragic $33,625 |
Demographics Similar to Salvadorans by Median Female Earnings
In terms of median female earnings, the demographic groups most similar to Salvadorans are German Russian ($37,105, a difference of 0.060%), Immigrants from Belize ($37,056, a difference of 0.070%), Dominican ($37,046, a difference of 0.10%), Nonimmigrants ($37,024, a difference of 0.16%), and Cree ($37,018, a difference of 0.18%).
| Demographics | Rating | Rank | Median Female Earnings |
| Hawaiians | 1.0 /100 | #257 | Tragic $37,497 |
| Belizeans | 0.9 /100 | #258 | Tragic $37,429 |
| Scotch-Irish | 0.8 /100 | #259 | Tragic $37,383 |
| Dutch | 0.7 /100 | #260 | Tragic $37,339 |
| Malaysians | 0.7 /100 | #261 | Tragic $37,298 |
| Venezuelans | 0.7 /100 | #262 | Tragic $37,282 |
| German Russians | 0.5 /100 | #263 | Tragic $37,105 |
| Salvadorans | 0.4 /100 | #264 | Tragic $37,083 |
| Immigrants | Belize | 0.4 /100 | #265 | Tragic $37,056 |
| Dominicans | 0.4 /100 | #266 | Tragic $37,046 |
| Immigrants | Nonimmigrants | 0.4 /100 | #267 | Tragic $37,024 |
| Cree | 0.4 /100 | #268 | Tragic $37,018 |
| Immigrants | Venezuela | 0.4 /100 | #269 | Tragic $37,003 |
| French American Indians | 0.3 /100 | #270 | Tragic $36,920 |
| Nicaraguans | 0.3 /100 | #271 | Tragic $36,904 |