Guatemalan vs Salvadoran Median Female Earnings
COMPARE
Guatemalan
Salvadoran
Median Female Earnings
Median Female Earnings Comparison
Guatemalans
Salvadorans
$35,695
MEDIAN FEMALE EARNINGS
0.0/ 100
METRIC RATING
293rd/ 347
METRIC RANK
$37,083
MEDIAN FEMALE EARNINGS
0.4/ 100
METRIC RATING
264th/ 347
METRIC RANK
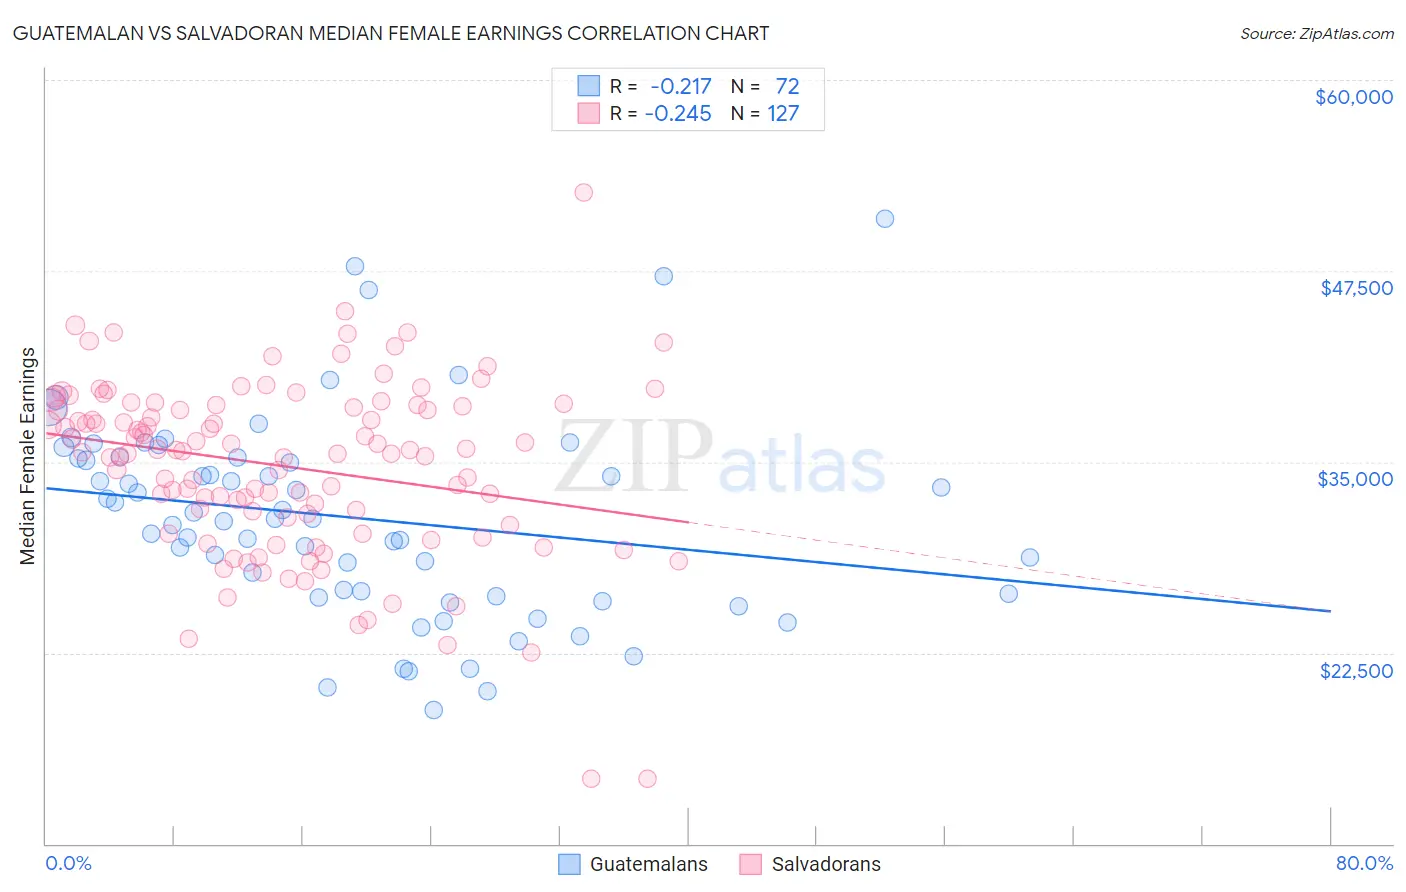
Guatemalan vs Salvadoran Median Female Earnings Correlation Chart
The statistical analysis conducted on geographies consisting of 409,414,975 people shows a weak negative correlation between the proportion of Guatemalans and median female earnings in the United States with a correlation coefficient (R) of -0.217 and weighted average of $35,695. Similarly, the statistical analysis conducted on geographies consisting of 398,898,517 people shows a weak negative correlation between the proportion of Salvadorans and median female earnings in the United States with a correlation coefficient (R) of -0.245 and weighted average of $37,083, a difference of 3.9%.
Median Female Earnings Correlation Summary
| Measurement | Guatemalan | Salvadoran |
| Minimum | $18,750 | $14,245 |
| Maximum | $50,917 | $52,604 |
| Range | $32,167 | $38,359 |
| Mean | $31,367 | $34,711 |
| Median | $31,263 | $35,673 |
| Interquartile 25% (IQ1) | $26,284 | $31,372 |
| Interquartile 75% (IQ3) | $35,245 | $38,695 |
| Interquartile Range (IQR) | $8,961 | $7,323 |
| Standard Deviation (Sample) | $6,641 | $5,811 |
| Standard Deviation (Population) | $6,594 | $5,788 |
Similar Demographics by Median Female Earnings
Demographics Similar to Guatemalans by Median Female Earnings
In terms of median female earnings, the demographic groups most similar to Guatemalans are Cheyenne ($35,673, a difference of 0.060%), Comanche ($35,661, a difference of 0.090%), Mexican American Indian ($35,629, a difference of 0.19%), American ($35,777, a difference of 0.23%), and Blackfeet ($35,864, a difference of 0.47%).
| Demographics | Rating | Rank | Median Female Earnings |
| Osage | 0.0 /100 | #286 | Tragic $36,034 |
| Immigrants | Nicaragua | 0.0 /100 | #287 | Tragic $36,023 |
| Immigrants | Zaire | 0.0 /100 | #288 | Tragic $36,017 |
| Bangladeshis | 0.0 /100 | #289 | Tragic $35,960 |
| Central American Indians | 0.0 /100 | #290 | Tragic $35,930 |
| Blackfeet | 0.0 /100 | #291 | Tragic $35,864 |
| Americans | 0.0 /100 | #292 | Tragic $35,777 |
| Guatemalans | 0.0 /100 | #293 | Tragic $35,695 |
| Cheyenne | 0.0 /100 | #294 | Tragic $35,673 |
| Comanche | 0.0 /100 | #295 | Tragic $35,661 |
| Mexican American Indians | 0.0 /100 | #296 | Tragic $35,629 |
| Hmong | 0.0 /100 | #297 | Tragic $35,498 |
| Immigrants | Micronesia | 0.0 /100 | #298 | Tragic $35,477 |
| Immigrants | Guatemala | 0.0 /100 | #299 | Tragic $35,444 |
| Yuman | 0.0 /100 | #300 | Tragic $35,377 |
Demographics Similar to Salvadorans by Median Female Earnings
In terms of median female earnings, the demographic groups most similar to Salvadorans are German Russian ($37,105, a difference of 0.060%), Immigrants from Belize ($37,056, a difference of 0.070%), Dominican ($37,046, a difference of 0.10%), Nonimmigrants ($37,024, a difference of 0.16%), and Cree ($37,018, a difference of 0.18%).
| Demographics | Rating | Rank | Median Female Earnings |
| Hawaiians | 1.0 /100 | #257 | Tragic $37,497 |
| Belizeans | 0.9 /100 | #258 | Tragic $37,429 |
| Scotch-Irish | 0.8 /100 | #259 | Tragic $37,383 |
| Dutch | 0.7 /100 | #260 | Tragic $37,339 |
| Malaysians | 0.7 /100 | #261 | Tragic $37,298 |
| Venezuelans | 0.7 /100 | #262 | Tragic $37,282 |
| German Russians | 0.5 /100 | #263 | Tragic $37,105 |
| Salvadorans | 0.4 /100 | #264 | Tragic $37,083 |
| Immigrants | Belize | 0.4 /100 | #265 | Tragic $37,056 |
| Dominicans | 0.4 /100 | #266 | Tragic $37,046 |
| Immigrants | Nonimmigrants | 0.4 /100 | #267 | Tragic $37,024 |
| Cree | 0.4 /100 | #268 | Tragic $37,018 |
| Immigrants | Venezuela | 0.4 /100 | #269 | Tragic $37,003 |
| French American Indians | 0.3 /100 | #270 | Tragic $36,920 |
| Nicaraguans | 0.3 /100 | #271 | Tragic $36,904 |